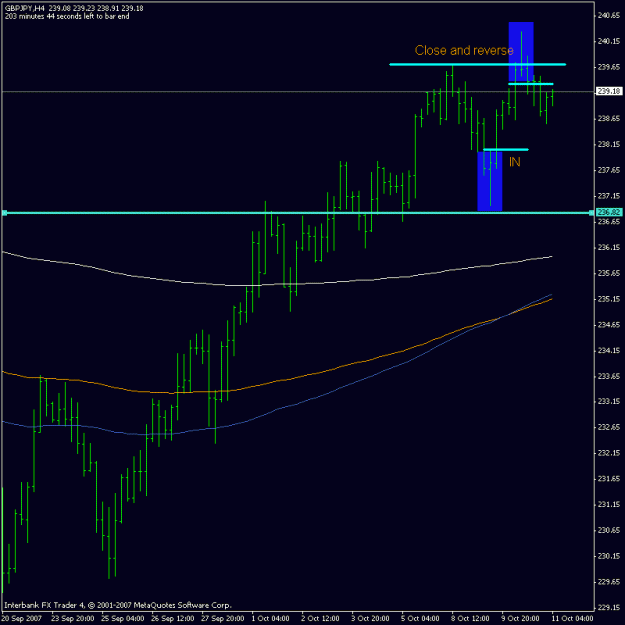
DislikedYes it will certainly depend on your timeframe. I am a big 4hr guy, and here is what i see. Currently the 4hr is trending up as indicated by the higher highs and higher lows(blue lines). We can see the downtrend line broken, starting our uptrend, and the final look for a bounce at 61.8 was broken. So for me this means, ok let's look for reasons to get into this trade. At this time, I would be looking to buy, but not without confirmation somewhere. This can come in many forms such as:
Bounce off new trendline, consolidation and breakout of that consolidation with the new trend.
For right now I am in wait mode but will keep an eye for buying opportunities.Ignored
Thank you for that informative discussion. I can see your point. I have a few questions? Do you use the 78.6% retracement in your fib calculations? From the looks of it you don't. Can you explain? Also your use of trendlines was very good. I use them too but I don't seem to always draw the best looking ones or trust there breaks. But I do see a very nice bullish candle showing good strength right through your downward trend line. Very good sign for your upward bias. Trendlines are something I must get better at. Also to me it looks like the daily formed a pin bar on Interbankfx. Do you agree that it is a pin bar? If not can you tell me why? I try to use a ratio system when finding pin bars. I really like when a pin for a short closes in the bottom 25% of the range. Or a pin for a buy closes in the top 75%. Do you kind of classify your pins like this? Also I didn't see any MA's this time. Do you only use those for certain pairs or set-ups? Thanks for the help. Anyone else is welcome to comment too.