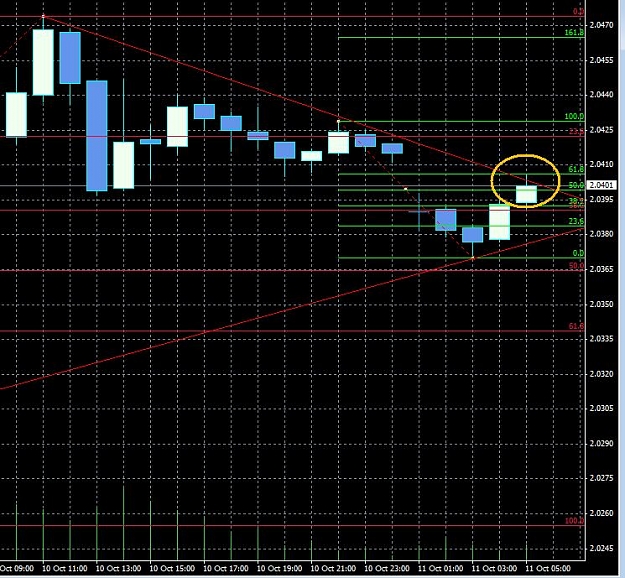
DislikedPerform this exersize with the swing fib on todays GBP/USD 1hour chart:
1. place it from top to bottom from the high of the 0900 candle where it made its high earlier today to the low of the 0400 candle. and observe what happens with price and the fib levels.
2.now swing the low to the low in made on the 1100 candle and observe the candles and fib levels after it.
3 swing the high now to the high of the 1400 candle and observe the candles and fib levels after 1400.
4 Swing the low now to the low of the 1800 candle and observe what has happened since the 1800 candle...
Do you see how price has respected the levels and where it made its reversal of directions at ?
This what you will see me refer to as following the market with the swing fib.The purpose is to find that break away from them or use them once you are in a trade to watch for the market to turn against you.
The market is a Lamborghini and Im giving you the keys to it.Ignored
- #65
- Oct 10, 2007 8:13pm Oct 10, 2007 8:13pm
- | Joined Oct 2007 | Status: Nomad | 1,144 Posts
"Support and Resistance either holds or it doesn't."
-Anonymous hillbilly
- #72
- Oct 10, 2007 10:15pm Oct 10, 2007 10:15pm
- | Joined Oct 2007 | Status: Nomad | 1,144 Posts
"Support and Resistance either holds or it doesn't."
-Anonymous hillbilly
- #74
- Oct 10, 2007 10:43pm Oct 10, 2007 10:43pm
- | Joined Oct 2007 | Status: Nomad | 1,144 Posts
"Support and Resistance either holds or it doesn't."
-Anonymous hillbilly