also keep a watch for the bounce from the 200 EMA, it is repelling prices up, if this breaks convincngly, we may get to see 235.40 very soon, i would expect 235.70 area to give some support
the charts tell the story...it was trying to break the 236.55 resistance but could not as it did not have the power, it will range within a 50-60 pip range till US news and then we may see a breakout more profoundly.
watch how this trendline now acts as resistance as price tries to go above it
ok guys, am off trading now as news is out in 30 mins...i dont recommend keeping any trades open , if in profit close them and keep off...and if in minus.keep a tight SL, coz whipsaws can happen during news
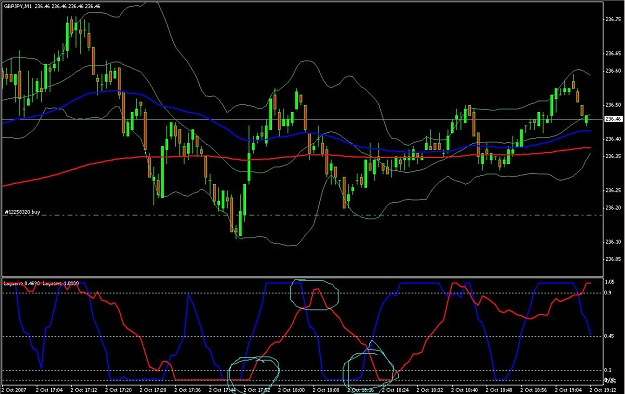
My question is - I have made 3 circles in light blue color... The RED Leg is always lagging the BLUE Leg and I understand you say that both Legs should be pointing in the same direction - so do these marked points not make for a good trade call?
Most of the times I am seeing this kind of lagging behavior on the 2nd Leg indicator... because of which all signals look inappropriate to me... please help.
i think you have to take the trade with the laguerre1 or the blue color line. first circle take trade on bleu wait for red ( laguerre 2 )to follow untill red turns to the dotted line where you close the trade by selling (second circle)
thirt circle idem .
but who can give a better answer then the master himself?
My question is - I have made 3 circles in light blue color... The RED Leg is always lagging the BLUE Leg and I understand you say that both Legs should be pointing in the same direction - so do these marked points not make for a good trade call?
Most of the times I am seeing this kind of lagging behavior on the 2nd Leg indicator... because of which all signals look inappropriate to me... please help.
Thanks,
-A.
Ignored
Hello Apume,
I was looking over your chart and curious to know two things, how did you apply both Lag #1 and #2 to show up on one chart and also the circles.
Thanks
In MT4, if you pull the Leg indicator from the Indicators panel (for Leg2) into the existing window of the Leg1 and make the settings as desired ... it will show up in that same window as Leg1. Just change the color and the settings.
The circle was drawn in MS Paint by using the Pencil in that application... .
Hello Apume,
I was looking over your chart and curious to know two things, how did you apply both Lag #1 and #2 to show up on one chart and also the circles.
Thanks
Sure, I understand what you are saying - but in the last few posts, Imran has said that both the Legs should be trending in the same direction and I do not see that happening most of the times... so I am kinda not sure of when to pull the trigger - which is what I wanted to confirm with Imran.
Sure, you do see both trending in the same direction way after the entry point has passed, but not before... help needed .
i think you have to take the trade with the laguerre1 or the blue color line. first circle take trade on bleu wait for red ( laguerre 2 )to follow untill red turns to the dotted line where you close the trade by selling (second circle)
thirt circle idem .
but who can give a better answer then the master himself?
if red comes shortly AFTER blue, then red is kinda for confirmation.
take profit at key levels. you dont always have to wait for the red exit signal to take all profit. the 'next' entry signal is not neccessarily for 'reversal'.
i think you have to take the trade with the laguerre1 or the blue color line. first circle take trade on bleu wait for red ( laguerre 2 )to follow untill red turns to the dotted line where you close the trade by selling (second circle)
thirt circle idem .
but who can give a better answer then the master himself?
Ignored
you have said it much better , u take the trade with the Blue Laguerre and then exit using the red laguerre
Hello Apume,
I was looking over your chart and curious to know two things, how did you apply both Lag #1 and #2 to show up on one chart and also the circles.
Thanks
Ignored
You need to drag the second Laguerre to the first laguerre window and it wil get added. The circles were mostly added after saving the chart using some paint software
Sure, I understand what you are saying - but in the last few posts, Imran has said that both the Legs should be trending in the same direction and I do not see that happening most of the times... so I am kinda not sure of when to pull the trigger - which is what I wanted to confirm with Imran.
Sure, you do see both trending in the same direction way after the entry point has passed, but not before... help needed .
Thanks,
-A.
Ignored
Apume
what i meant was the direction of both the Lags should be in the same direction, not necessary for both to be in same location or same position.
Also if one lag is below 0.45 and the other is still above, u can take the trade
if red comes shortly AFTER blue, then red is kinda for confirmation.
take profit at key levels. you dont always have to wait for the red exit signal to take all profit. the 'next' entry signal is not neccessarily for 'reversal'.
in trending mkt stick w the main trend.
Ignored
you are correct, red laguerre is only for confirmation and for exiting the trade as it always lags behind the blue, but till the red laguerre does not come below or to the top the trade is still on unless u see some major resistance or fibs at those location or EMA's converging
My question is - I have made 3 circles in light blue color... The RED Leg is always lagging the BLUE Leg and I understand you say that both Legs should be pointing in the same direction - so do these marked points not make for a good trade call?
Most of the times I am seeing this kind of lagging behavior on the 2nd Leg indicator... because of which all signals look inappropriate to me... please help.
Thanks,
-A.
Ignored
From what i see on the charts, u could have easily made more then 70+ pips from those price action,
MTF lag may be useful with this system to help quide the 1 minute chart.
Please post MTF lag if you have one. Message for everyone.
Ignored
Hi All,
I have made a form of Laguerre which can plot two lines by itself. The second line is set to plot higher timeframe Laguerre, but it can be changed to plot same timeframe line with different gamma setting. The Input data are (for Laguerre2.ex4 which has the MTF plotter; this is exactly what I am checking):
gamma1=0.6; (gamma for first line, which uses the chart timeframe)
gamma2=0.0; (when zero, uses same gamma as the first line)
MaxBars=950; (Does the calculation for last 950 bars, at the start)
TimeFrame2=0; (timeframe for second line; when zero, uses the next higher timeframe than chart timeframe)
(the levels are drawn at 0.15, 0.50, 0.85)
The file Laguerre2A.ex4 has the Imran's settings as default as shown below (it does not have MTF plotting option because I simplified the calculations):
gamma1=0.55;
gamma2=0.85;
MaxBars=950;
(the levels are drawn at 0.15, 0.45, 0.85)
I hope it will be useful for some users. I also wish to thank Imran for sharing his very good method.
CAUTION: When using MTF line, the last few bars' (not just last bar) values will change because last few bars will belong to a single bar in the higher timeframe. For example, if you are looking at 14 min in 1 min chart, all 10-14 bars values will change together (and if you saw some signal at 12 min, it may disappear at the end of 14 min or before!, but that will happen if you used the higher timeframe chart also).
I have made a form of Laguerre which can plot two lines by itself. The second line is set to plot higher timeframe Laguerre, but it can be changed to plot same timeframe line with different gamma setting. The Input data are (for Laguerre2.ex4 which has the MTF plotter; this is exactly what I am checking):
gamma1=0.6; (gamma for first line, which uses the chart timeframe)
gamma2=0.0; (when zero, uses same gamma as the first line)
MaxBars=950; (Does the calculation for last 950 bars, at the start)
TimeFrame2=0; (timeframe for second line; when zero, uses the next higher timeframe)
(the levels are drawn at 0.15, 0.50, 0.85)
The file Laguerre2A.ex4 has the Imran's settings as default as shown below (it does not have MTF plotting option because I simplified the calculations):
gamma1=0.55;
gamma2=0.85;
MaxBars=950;
(the levels are drawn at 0.15, 0.45, 0.85)
I hope it will be useful for some users. I also wish to thank Imran for sharing his very good method.
CAUTION: When using MTF line, the last few bars' (not just last bar) values will change because last few bars will belong to a single bar in the higher timeframe. For example, if you are looking at 14 min in 1 min chart, all 10-14 bars values will change together (and if you saw some signal at 12 min, it may disappear at the end of 14 min or before!, but that will happen if you used the higher timeframe chart also).
Regards,
chandra
Ignored
wow, this looks really good, i will test it out and let all know the result