The Big Picture
Global capital is constantly rotating. Money moves between equities, bonds, commodities, and currencies depending on the macro regime. Rather than trying to capture directional moves, Relative Movement aims to identify the nature of the regime, then only take trades structurally aligned with that regime.
Regime Identification
First, I identify and monitor ratio-spreads ie Instrument A divided by Instrument B. I choose relevant instruments in which by comparison I can infer where capital may be leaning through their movement relative to one another. The ratios do not tell me the price or value of anything. Aligning multiple ratios gives a window into regime expression in real time without having to follow lots of data sets. When they align, I consider that a regime being expressed within the Relative Movement framework and therefore a tradeable environment.
Relating an instruments movement to another through ratio spreads can have a range of results. Two instruments can signal macro expressions, whilst the comparison of execution instruments can determine the best performer in certain regimes, thus maximising the potential for profit and drawdown reduction.
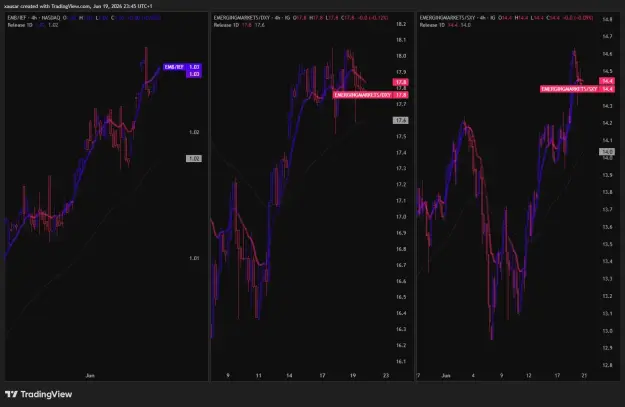
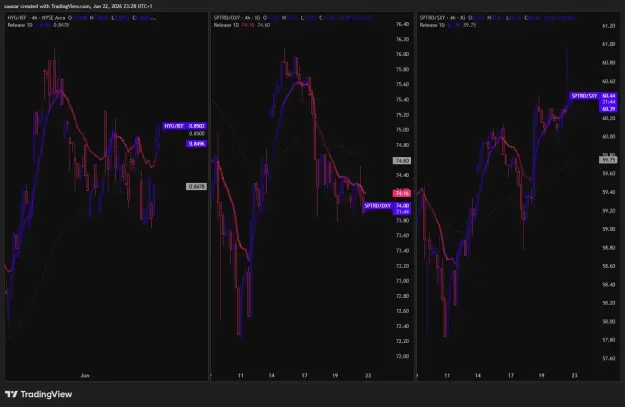
For example. For US Equities. I can compare:
HYG/IEF (High Yield Corporate "Junk" Bond ETF at 7-10 year duration to US Treasuries at 7-10 year duration).
I use this comparison as a proxy for credit appetite in the US. The yield of high performing but risky corporate bonds vs low yielding but safe US treasuries. When riskier bonds are outperforming safer bonds, I generally interpret that as a more risk-on credit environment.
SP500/DXY (SP500 Index vs Dollar Basket Index).
I use this comparison as a broad gauge of liquidity conditions in the market. The SP500 rises for many reasons, though I tend to view long-term appreciation as being helped by the gradual debasement of fiat currencies. If the US dollar begins to outperform the SP500, I interpret that as dollar strength increasing and the long-term tailwind from currency debasement becoming less supportive for equities, which I consider bearish. A stronger dollar can coincide with tighter financial conditions and may eventually feed through to weaker earnings growth.
SP500/SXY (SP500 Index vs Swiss Franc Index).
I use this comparison as a broad gauge of fear sentiment. The swiss franc is a safe-haven currency. It gains strength during periods of financial stress and increasing fear. When this outperforms the SP500, it can often indicate that appetite for risk is decreasing and may suggest increasing demand for defensive CHF exposure.
When all three align, I consider it a highly tradeable regime expression.
I trade US equities and Global equities, commodities and duration. I can compare SP500/EEM (Sp500 vs Emerging Markets Index) to distinguish where capital is flowing and decide where to allocate risk. To me, this is what makes Relative Movement compelling; it can very quickly isolate both strength and regime.
The point of this thread however will be to journal my trades or at least my expressions in the market. Ill make updates regarding thoughts on the market as well as positions, this wont be a copy signal thread as focus will be on expressing the market macro.
To determine strength through the ratio spreads I use my very own "Release" indicator. It attempts to distinguish a binary balance between bullish and bearish conditions through percentages to be consistent through multiple different instruments and ratio spreads. I will be uploading pictures of what I see.
Regarding execution, as a regime trader I have always struggled with execution but as an old student of Architecture, I found it rather easy to find technical structure. After years of testing and trading, I've found value in both approaches. The way I structure my trades then follows like this. Let's say 100% of the position is our total. 25% represents the initial regime expression once my ratio spreads align. When these macro expressions are gaining momentum on all relevant ratio spreads, I add an additional 35%. So now I have a general regime-on or regime-off position, followed by a second position intended to capture regime acceleration. A final 40% is added from separate context which is the execution chart itself confirming momentum from our regime. This 40% position has a trailing stop which is loose when momentum is strong and tightens to near structure when it begins to turn. This means I have three distinct positions, each with its own reason for existing. I always use a Guaranteed Stop Loss Order on my trailing position, as I will likely hold through weekends.
Okay I think that's probably enough for the head comment. I can answer questions if you're interested in my strategy, regarding my trading history.
Separate background history: I began approaching trading systematically in April 2024.. Doing a live demo in September 2024 til Dec 2025 and then going live in 2026 Jan. My strategies changed a lot in that time but Relative Movement hasn't changed much since going live, more so experimenting on the range of instruments I can trade. Relative Movement has recently sharpened its risk management to retain both aggression and defensiveness. I don't yet know what its long-term return profile looks like, but I'm confident in its potential for profitability, as so far the return profile has been relatively steady despite a fairly turbulent market environment. I don't feel comfortable putting my balance online and I am not sure how consistently my executions will post, I am not particularly interested in building a following, proving anything, or maintaining a public track record. I'd like this thread to more so be a macro demonstration of these ratio spreads with some executions spiced in.
Global capital is constantly rotating. Money moves between equities, bonds, commodities, and currencies depending on the macro regime. Rather than trying to capture directional moves, Relative Movement aims to identify the nature of the regime, then only take trades structurally aligned with that regime.
Regime Identification
First, I identify and monitor ratio-spreads ie Instrument A divided by Instrument B. I choose relevant instruments in which by comparison I can infer where capital may be leaning through their movement relative to one another. The ratios do not tell me the price or value of anything. Aligning multiple ratios gives a window into regime expression in real time without having to follow lots of data sets. When they align, I consider that a regime being expressed within the Relative Movement framework and therefore a tradeable environment.
Relating an instruments movement to another through ratio spreads can have a range of results. Two instruments can signal macro expressions, whilst the comparison of execution instruments can determine the best performer in certain regimes, thus maximising the potential for profit and drawdown reduction.
For example. For US Equities. I can compare:
HYG/IEF (High Yield Corporate "Junk" Bond ETF at 7-10 year duration to US Treasuries at 7-10 year duration).
I use this comparison as a proxy for credit appetite in the US. The yield of high performing but risky corporate bonds vs low yielding but safe US treasuries. When riskier bonds are outperforming safer bonds, I generally interpret that as a more risk-on credit environment.
SP500/DXY (SP500 Index vs Dollar Basket Index).
I use this comparison as a broad gauge of liquidity conditions in the market. The SP500 rises for many reasons, though I tend to view long-term appreciation as being helped by the gradual debasement of fiat currencies. If the US dollar begins to outperform the SP500, I interpret that as dollar strength increasing and the long-term tailwind from currency debasement becoming less supportive for equities, which I consider bearish. A stronger dollar can coincide with tighter financial conditions and may eventually feed through to weaker earnings growth.
SP500/SXY (SP500 Index vs Swiss Franc Index).
I use this comparison as a broad gauge of fear sentiment. The swiss franc is a safe-haven currency. It gains strength during periods of financial stress and increasing fear. When this outperforms the SP500, it can often indicate that appetite for risk is decreasing and may suggest increasing demand for defensive CHF exposure.
When all three align, I consider it a highly tradeable regime expression.
I trade US equities and Global equities, commodities and duration. I can compare SP500/EEM (Sp500 vs Emerging Markets Index) to distinguish where capital is flowing and decide where to allocate risk. To me, this is what makes Relative Movement compelling; it can very quickly isolate both strength and regime.
The point of this thread however will be to journal my trades or at least my expressions in the market. Ill make updates regarding thoughts on the market as well as positions, this wont be a copy signal thread as focus will be on expressing the market macro.
To determine strength through the ratio spreads I use my very own "Release" indicator. It attempts to distinguish a binary balance between bullish and bearish conditions through percentages to be consistent through multiple different instruments and ratio spreads. I will be uploading pictures of what I see.
Regarding execution, as a regime trader I have always struggled with execution but as an old student of Architecture, I found it rather easy to find technical structure. After years of testing and trading, I've found value in both approaches. The way I structure my trades then follows like this. Let's say 100% of the position is our total. 25% represents the initial regime expression once my ratio spreads align. When these macro expressions are gaining momentum on all relevant ratio spreads, I add an additional 35%. So now I have a general regime-on or regime-off position, followed by a second position intended to capture regime acceleration. A final 40% is added from separate context which is the execution chart itself confirming momentum from our regime. This 40% position has a trailing stop which is loose when momentum is strong and tightens to near structure when it begins to turn. This means I have three distinct positions, each with its own reason for existing. I always use a Guaranteed Stop Loss Order on my trailing position, as I will likely hold through weekends.
Okay I think that's probably enough for the head comment. I can answer questions if you're interested in my strategy, regarding my trading history.
Separate background history: I began approaching trading systematically in April 2024.. Doing a live demo in September 2024 til Dec 2025 and then going live in 2026 Jan. My strategies changed a lot in that time but Relative Movement hasn't changed much since going live, more so experimenting on the range of instruments I can trade. Relative Movement has recently sharpened its risk management to retain both aggression and defensiveness. I don't yet know what its long-term return profile looks like, but I'm confident in its potential for profitability, as so far the return profile has been relatively steady despite a fairly turbulent market environment. I don't feel comfortable putting my balance online and I am not sure how consistently my executions will post, I am not particularly interested in building a following, proving anything, or maintaining a public track record. I'd like this thread to more so be a macro demonstration of these ratio spreads with some executions spiced in.
Attached Image(s) (click to enlarge)


Money never disappears. It only changes allegiance.