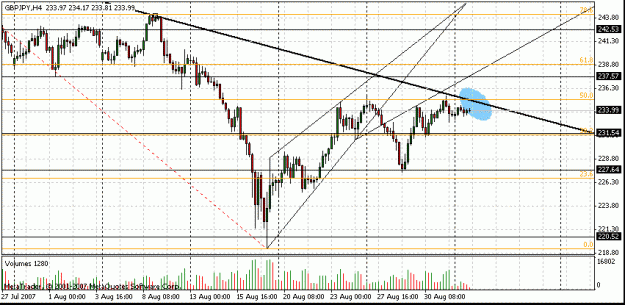
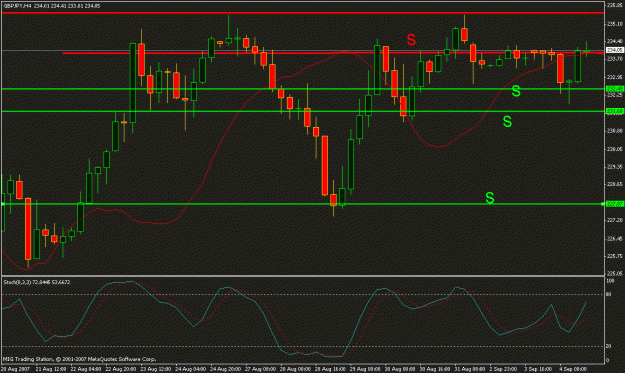
DislikedGoing back to a chart I posted a bit over a week ago, it seems to be working out OK.
The highs were not being reached and the lows went lower so I lost a bit of faith - but it is playing out well now. I have the high at about 238.80 (but could be 100 pips or so lower) before we see that large fall to retest the low in the 219 region. Based on some time analysis (not mine), the high should be in on the 4th or 5th of Sep (Tue/Wed).
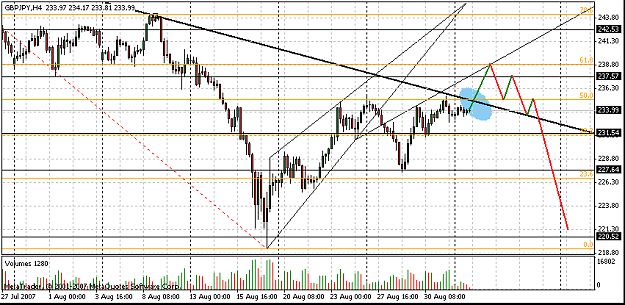
I suspect it is going to fail and reverse around 221.50 and head all the way up to the 242 to 245 region (red circle). That will be a good test to see whether the bulls can pull it out and if so then up, up and away we go. I do, however, expect it to fail and then we could possibly see the low break (219).
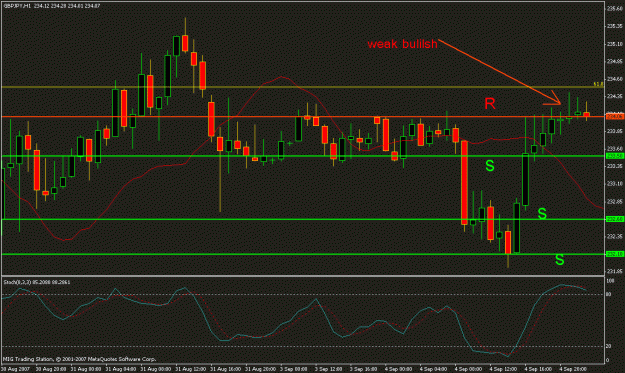
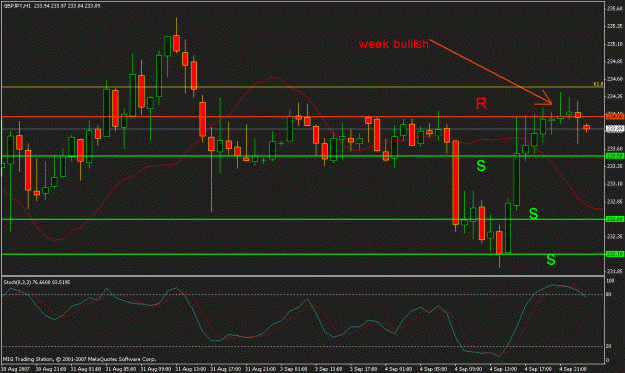
I have attached the chart that I posted a little over a week ago and a new one with further projections.
ZIgnored
Regards,
Chris.