I built ORBit Analytics because I got tired of guessing how price actually behaves after the opening range. Most ORB content out there is anecdotal — "buy the breakout, it works." I wanted hard numbers: how often does a breakout continue vs. reverse, what does the day of week change, how far does it really run, how deep do winners pull back before they go.
So this is a browser-based stats tool that answers those questions from real futures data — not a hand-kept journal, not a cherry-picked sample. Every number is computed automatically from the actual 1-minute price history, going back to mid-2010 for the index/commodity symbols (~4,000 trading days) and to the CME launch for Bitcoin.
It's deliberately market-behaviour only — it shows you how the instrument moves, the edges hiding in the data, and lets you stress-test ideas. I'm not selling signals or a "system."
You can try it right now on Nasdaq (NQ) without signup: https://orbitanalytics.trading/
Btw Nasdaq will stay free forever for everyone!
What it does
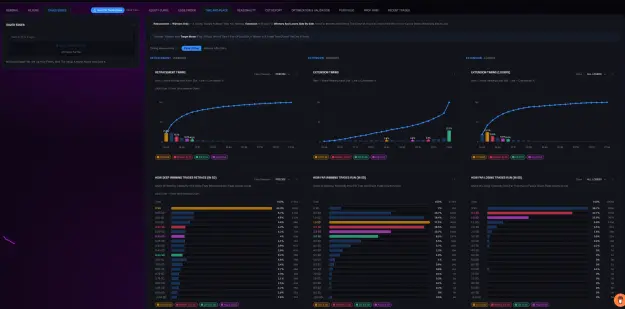
- Core ORB stats — continuation / reversal / faded-back-in / both-sides-broke rates, first-break direction, a long/short bias card, and full breakdowns by day of week, volatility regime (OR size vs. ADR), opening trend, overnight gap, trigger distance, news days and holidays.
- Pick your opening range — the free NY 15-minute range, or build any custom window (any start, any end, any session) with your choice of breakout trigger (first touch, or a 1 / 5 / 15-min candle close) on a paid plan. You can also set a custom stop (opposite edge, midpoint, or tighter).
- Breakout, reversal, or both — aggregate them into one equity curve and one set of stats.
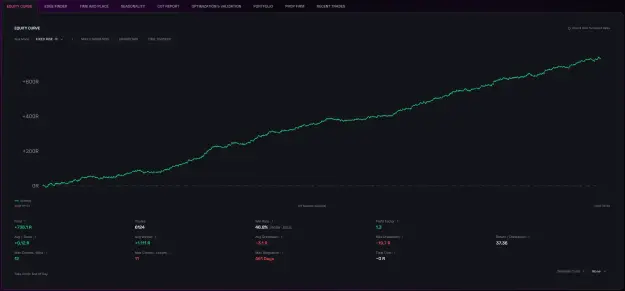
- A real equity curve — cumulate the filtered trades over time with different take-profits (end of day, or a 1 / 2 / 3 SD target). Fixed-R or compounded %, with a buy & hold benchmark, drawdown, stagnation bands and Monte Carlo.
- Edge finder — win%, profit factor, return/drawdown and total R broken down by direction, day, trend, volatility, bars-until-entry, trigger distance, gap, news and holidays. Every filter reshapes it live.
- Time & place — when and how far winners extend, and how deep they retrace before they run (so you can see where a stop actually belongs) — winners vs. losers side by side.
- Seasonality scanner — seasonal return curve, weekday returns, monthly matrix, detrended view, and you can promote up to 5 seasonal windows into recurring filters on the ORB stats.
- COT report — weekly Commitments of Traders positioning per symbol, a COT-index view, and a COT-index filter you can layer onto the breakout stats.
- Recent trades ledger — the last 12 months of filtered trades listed out, each one openable as a full candlestick chart, so you can pull any date up and verify it yourself.
- New since last time: saved edges (save a setup, reload it on any device), a Portfolio builder (blend several saved edges into one equity curve), Optimization & validation (out-of-sample split + Monte Carlo), and a prop-firm pass simulator (free for everyone — estimates pass rate, cost-to-funded and expected payout for Topstep / Apex / FTMO / The5%ers etc.).
- A free TradingView indicator — copy a preset string out of the tool and it draws your exact stat lines (extension / retracement / timing) live on your chart.
- Include / exclude / mixed filtering, timezone display, simulated costs, and a full-width "deep insights" mode.
13 instruments live today (was 6):
Nasdaq (NQ), S&P 500 (ES), Gold (GC), Crude (CL), Bitcoin (BTC), GBPUSD (6B) — plus newly added Euro (6E), Japanese Yen (6J), Dow (YM), DAX (FDAX), and the micros Micro Nasdaq (MNQ), Micro S&P (MES) and Micro Gold (MGC). Same methodology across all of them.
Believe me I have already found some Edges here that I have never heard about befor!
Example:
Nasdaq Long NY 15m ORB when Retail COT Index is oversold:

Pricing
- Nasdaq (NQ) is completely free forever
- Pick 2 Symbols of your Choice: 19€
- All-Access (every current and future symbol): 19€ THIS IS CURRENTLY AT A BIG EARLY BIRD DISCOUNT (Will be 49€ soon)
Paid plans run through Stripe; cancel any time.
What's planned
I'm building this in the open and post a changelog with every update (Currently putting in a lot of work pushing updates almost every day).
I welcome Feedback, Feature requests and Bug Reports!
Have a nice day!