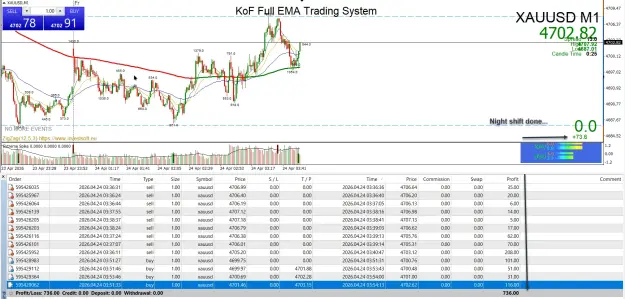
Disliked{quote} It's just the indicator6 line , as a comparison to the EMA50 line (or EMA9vsEMA20) with different models. If the color is magenta and below the yellow dot line, it indicates a strong sell. If it's above the yellow line, it indicates a sell correction All indicators are the same, they simply follow the price and the logic behind it. Just a different perspectiveIgnored
We don't see things as they are - we see things as we are.