You can find the full cpfleger's template and ruleset here: https://www.forexfactory.com/thread/...3#post14318063
Warning/Intro: This is a very aggresive/discretional strategy, so don't trade with money that you cannot afford to lose. Also, I AM NOT THE ORIGINAL CREATOR OF THIS STRATEGY! I just thought it would make a very interesting experiment to share and look into, as most systems online preach the "trend is your friend" mantra and in my experience this is not true (most of the time). The owner of the strategy claims that it is capable of generating consistent profits through time and that it will let you "join the 1%" club, so I believe these big claims should be put to the test.
Main Premises:
1) We know price is ranging most of the time, so it makes sense to exploit this type of movement over trends and/or momentum.
2) We know price is hard to "time" accurately, so we use more "loose" entry rules (averaging) to avoid the headache (and the losers).
3) We know grid systems tend to break and burn down the accounts, so we add price action to the formula and try to gain an "edge" over the market.
4) Hypothesis: Breakouts and trends are short lived in the lower timeframes (defined by the 9, 20 and 50 EMA touches).
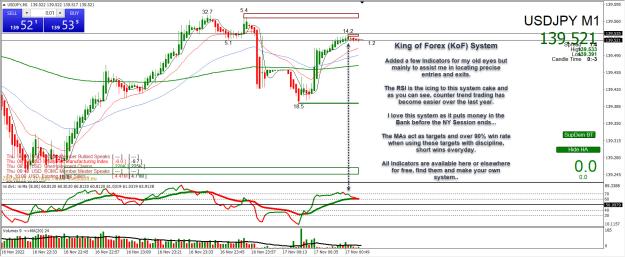
Timeframe & Chart Setup: EURUSD, GBPUSD, M1 (one minute) charts. Please note that the spread should be low enough for this to work (I recommend a ICMarkets standard account with the highest leverage available). Insert the 9, 20, 50, 200 period EMAs AND the volume indicator with a 20 MA overlay for reference (see example):
Rules:
1) Avoid trading "just-before" OR during news times.
2) Stick to the lower time-frames and one chart at a time (M1, M5).
3) Entries:
a) First Buy: Price close is BELOW ALL the 9, 20 AND 50 EMAs AND has a "good enough" distance away from these averages (more distance = more profits) .
b) First Sell: Price close is ABOVE ALL the 9, 20, AND 50 EMAs AND has a "good enough" distance away from these averages (more distance = more profits).
NOTE: What is a "good enough" distance is defined by your own discretion and depends in the current market conditions (volatility and structure). You may use support and resistance, band indicators, demand/supply zones, volume strength, waves theory, etc. I recommend you use simple support and resistance (horizontal levels) and volume readings to determine this (it will be more clear when you watch the examples below).
VERY IMPORTANT: Don't trade if price is still "stuck" between the EMAs.
4) Re-Entries: If price is going against your position, start placing new orders against the trend. The re-entry signal is the 9 EMA crossing your latest order horizontal level, see example:
NOTE: The main premise is that the longer you are inside a breakout, the higher the chances of price returning to the "mean", represented by the EMAs. If you are not in a breakout you should be making profits every swing with this system as you are most likely inside a range (where countertrend strategies work best).
5) Exits: As soon as price touches the nearest EMA that would let you exit in profits (may be a 9, 20, 50 or 200 EMA).
In a ranging/slow market the 20 EMA is an excelent option. If you are caught in a breakout and have several losing positions you may want to wait for a 50 EMA or 200 EMA touch instead, as most of your trades will become profitable by then. In some rare occasions a 9 EMA touch is the better option (i.e: When you caught a good chunk of the top or bottom after a breakout):
IMPORTANT! Do not let the trades run while you are distracted or worse: overnight!
6) Volume and discretional considerations:
a) If volume is above the 20 MA, price may still have enough fuel to keep pushing in the current direction. You may want to use volume weakening (safest) or strengthening (risky) to enter new postions. Both can work and it mostly depends on your risk appetite and trading experience.
b) Other minor MAs crossing above/below the 200 EMA is usually followed by volatile moves, so don't overleverage during these scenarios.
c) You may want to use price action (i.e: bar formations) and/or other type of information such as: waves theory, support and resistance, volatility bands, volume, etc. to try and call the tops and bottoms to enter new positions. However, remember that "simple works best", and the main premise is that you are fading trend/breakout traders and waiting for the "reversion to the mean" phenomenon.
Here is a video of the strategy in action that includes examples of tough trends/breakouts. Although you should remember that the main idea is to trade (mostly) ranges:
Examples:
* Example 1 (easy long trade):
- Entry/Setup

- Exit

* Example 2 (another easy long trade):
- Entry/Setup:

- Exit, and more hypotetical setups:
* Example 3 (tough breakouts/trends):
- Entry and other potential setups:
- Recovery trade example:

- Exit:
Please let me know what you think and what's your experience with this type of system.
Warning/Intro: This is a very aggresive/discretional strategy, so don't trade with money that you cannot afford to lose. Also, I AM NOT THE ORIGINAL CREATOR OF THIS STRATEGY! I just thought it would make a very interesting experiment to share and look into, as most systems online preach the "trend is your friend" mantra and in my experience this is not true (most of the time). The owner of the strategy claims that it is capable of generating consistent profits through time and that it will let you "join the 1%" club, so I believe these big claims should be put to the test.
Main Premises:
1) We know price is ranging most of the time, so it makes sense to exploit this type of movement over trends and/or momentum.
2) We know price is hard to "time" accurately, so we use more "loose" entry rules (averaging) to avoid the headache (and the losers).
3) We know grid systems tend to break and burn down the accounts, so we add price action to the formula and try to gain an "edge" over the market.
4) Hypothesis: Breakouts and trends are short lived in the lower timeframes (defined by the 9, 20 and 50 EMA touches).
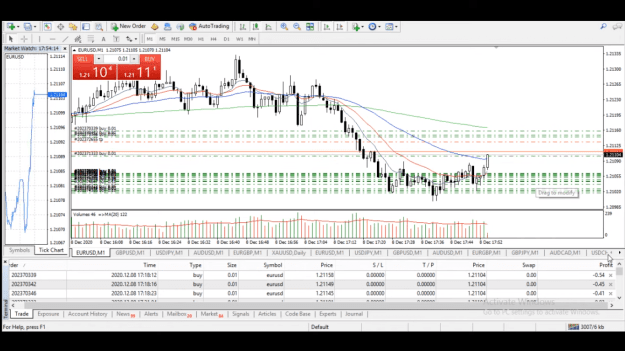
Timeframe & Chart Setup: EURUSD, GBPUSD, M1 (one minute) charts. Please note that the spread should be low enough for this to work (I recommend a ICMarkets standard account with the highest leverage available). Insert the 9, 20, 50, 200 period EMAs AND the volume indicator with a 20 MA overlay for reference (see example):
Attached Image (click to enlarge)
Rules:
1) Avoid trading "just-before" OR during news times.
2) Stick to the lower time-frames and one chart at a time (M1, M5).
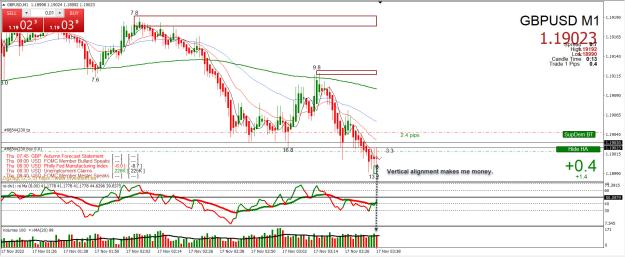
3) Entries:
a) First Buy: Price close is BELOW ALL the 9, 20 AND 50 EMAs AND has a "good enough" distance away from these averages (more distance = more profits) .
b) First Sell: Price close is ABOVE ALL the 9, 20, AND 50 EMAs AND has a "good enough" distance away from these averages (more distance = more profits).
NOTE: What is a "good enough" distance is defined by your own discretion and depends in the current market conditions (volatility and structure). You may use support and resistance, band indicators, demand/supply zones, volume strength, waves theory, etc. I recommend you use simple support and resistance (horizontal levels) and volume readings to determine this (it will be more clear when you watch the examples below).
VERY IMPORTANT: Don't trade if price is still "stuck" between the EMAs.
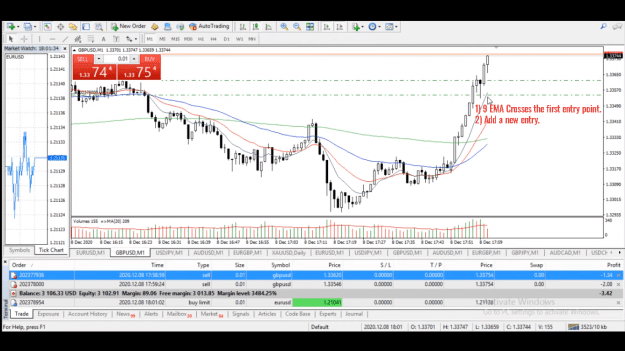
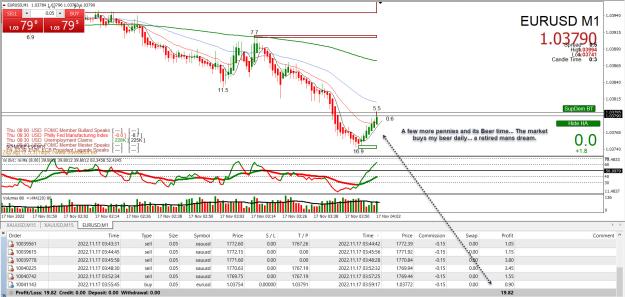
4) Re-Entries: If price is going against your position, start placing new orders against the trend. The re-entry signal is the 9 EMA crossing your latest order horizontal level, see example:
Attached Image (click to enlarge)
NOTE: The main premise is that the longer you are inside a breakout, the higher the chances of price returning to the "mean", represented by the EMAs. If you are not in a breakout you should be making profits every swing with this system as you are most likely inside a range (where countertrend strategies work best).
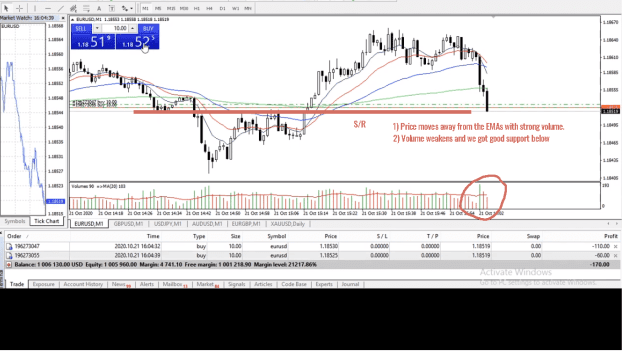
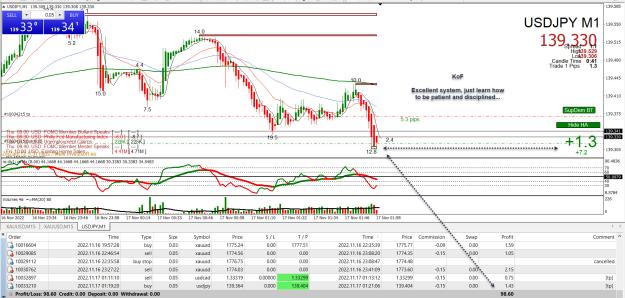
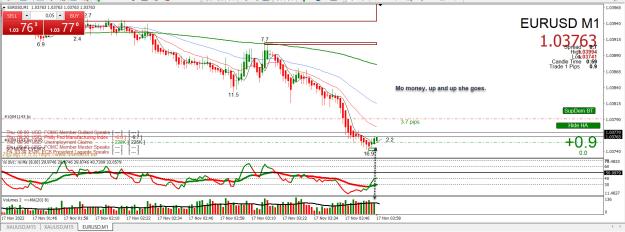
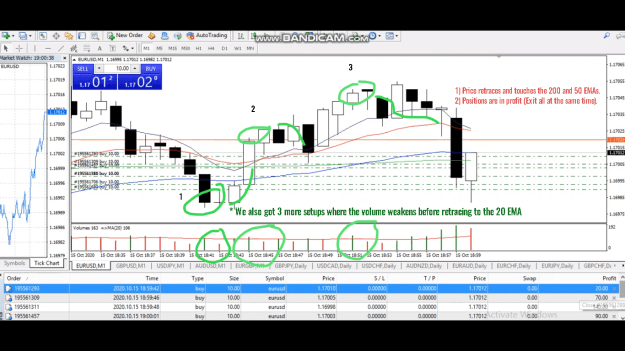
5) Exits: As soon as price touches the nearest EMA that would let you exit in profits (may be a 9, 20, 50 or 200 EMA).
In a ranging/slow market the 20 EMA is an excelent option. If you are caught in a breakout and have several losing positions you may want to wait for a 50 EMA or 200 EMA touch instead, as most of your trades will become profitable by then. In some rare occasions a 9 EMA touch is the better option (i.e: When you caught a good chunk of the top or bottom after a breakout):
Attached Image (click to enlarge)
IMPORTANT! Do not let the trades run while you are distracted or worse: overnight!
6) Volume and discretional considerations:
a) If volume is above the 20 MA, price may still have enough fuel to keep pushing in the current direction. You may want to use volume weakening (safest) or strengthening (risky) to enter new postions. Both can work and it mostly depends on your risk appetite and trading experience.
b) Other minor MAs crossing above/below the 200 EMA is usually followed by volatile moves, so don't overleverage during these scenarios.
c) You may want to use price action (i.e: bar formations) and/or other type of information such as: waves theory, support and resistance, volatility bands, volume, etc. to try and call the tops and bottoms to enter new positions. However, remember that "simple works best", and the main premise is that you are fading trend/breakout traders and waiting for the "reversion to the mean" phenomenon.
Here is a video of the strategy in action that includes examples of tough trends/breakouts. Although you should remember that the main idea is to trade (mostly) ranges:
Inserted Video
Examples:
* Example 1 (easy long trade):
- Entry/Setup
Attached Image (click to enlarge)
- Exit
Attached Image (click to enlarge)
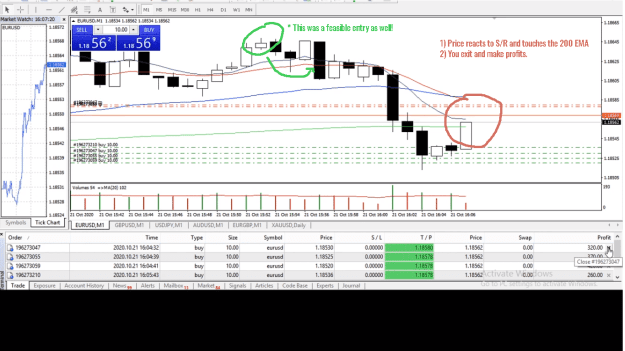
* Example 2 (another easy long trade):
- Entry/Setup:
Attached Image (click to enlarge)
- Exit, and more hypotetical setups:
Attached Image (click to enlarge)
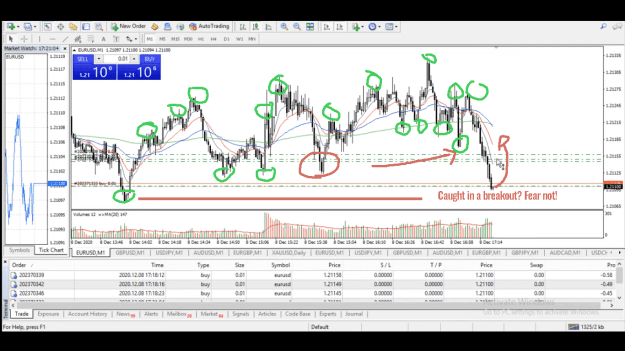
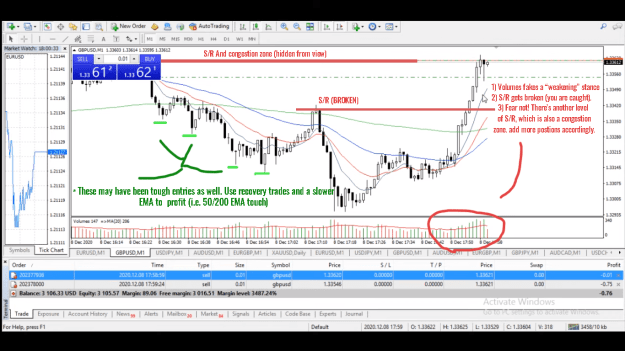
* Example 3 (tough breakouts/trends):
- Entry and other potential setups:
Attached Image (click to enlarge)
- Recovery trade example:
Attached Image (click to enlarge)
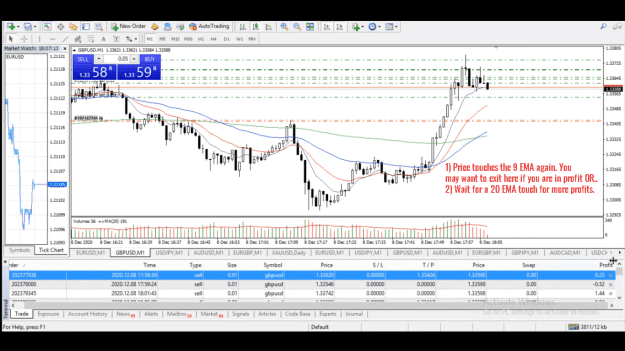
- Exit:
Attached Image (click to enlarge)
Please let me know what you think and what's your experience with this type of system.