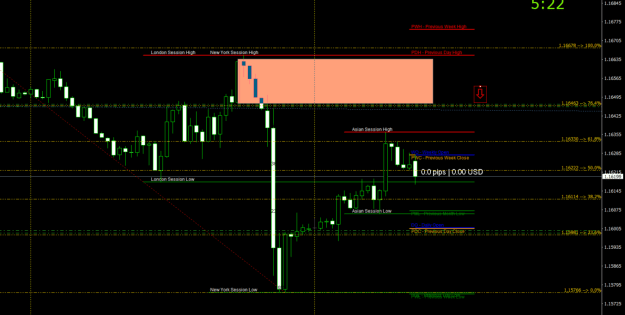
The EUR/USD pair is currently forming a symmetrical triangle, a classic consolidation pattern that typically precedes a breakout. This structure reflects market indecision, where buyers and sellers are gradually converging toward a key inflection point.
Overlaying this triangle is a Fibonacci retracement grid, drawn from the recent swing high to swing low. The retracement levels — 23.6%, 38.2%, 50%, 61.8%, and 78.6% — serve as potential support/resistance zones and breakout targets.
A critical price level of 1.16257 sits near the apex of the triangle, acting as a potential breakout trigger. Volume confirmation and candle structure around this level will be essential in validating any move.
 Trading Scenarios Explained
 Bullish Breakout
If price breaks above 1.16257 with strong bullish momentum and volume:
Overlaying this triangle is a Fibonacci retracement grid, drawn from the recent swing high to swing low. The retracement levels — 23.6%, 38.2%, 50%, 61.8%, and 78.6% — serve as potential support/resistance zones and breakout targets.
A critical price level of 1.16257 sits near the apex of the triangle, acting as a potential breakout trigger. Volume confirmation and candle structure around this level will be essential in validating any move.
If price breaks above 1.16257 with strong bullish momentum and volume:
- Target 1: 61.8% Fibonacci (~1.1655)
- Target 2: 78.6% Fibonacci (~1.1678)
- Stop Loss: Below triangle support (~1.1600)
- Strategy: Partial exit at first target, trail stop for remainder
![]() Bearish Breakdown
Bearish Breakdown
If price breaks below triangle support with a bearish candle and volume spike:
- Target 1: 23.6% Fibonacci (~1.1580)
- Target 2: Previous swing low (~1.1550)
- Stop Loss: Above triangle resistance (~1.1625)
- Strategy: Partial exit at first target, trail stop for remainder
![]() Fake Breakout
Fake Breakout
If price briefly breaks out but quickly returns inside the triangle:
- Avoid entry until breakout is confirmed with volume
- Fakeouts often lead to stop hunts and sharp reversals
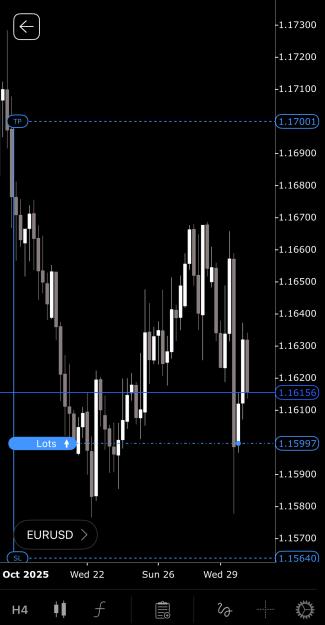
Attached Image (click to enlarge)

4