BULLISH ON NZD/USD DAILY CHART-12 MARCH 2025:
My Confluence Factors include:
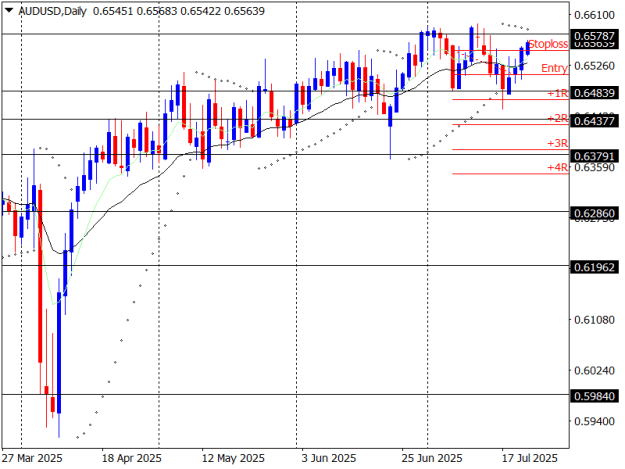
a) DAILY CHART TREND (MARKET STRUCTURE): The market is forming a fresh return higher after failing to go back all the way down to 0.5544 indicating that buyers have resumed powers taking the price to close higher above the 0.5692 resistance.
B) RESTRACEMENT**Bow and Arrow Concept: It then pulled back and retraced to the 21-Day EMA & the resistance now turned support at 0.5692 poking it and forming a bullish small tailed bar on the daily chart. The quality of the set-up was not the perfect hence was cautious and risked less than 1%.
C) DAILY CHART LEVEL: Price formed a Daily Chart BULLISH TAILED BAR THAT POKED THROUGH THE 21-DAY Daily Chart EMA LEVEL; The 8-Day EMA Level was crossed above the 21-Day EMA forming a bullish channel on the Daily Chart and even the P.Sar Dots supported this move.
D) DAILY CHART SIGNAL/CATAPULT/POKEMON: BULLISH TAILED BAR poking through 21-day EMA.
Other Thoughts:
a) Which Side of 21-EMA is the price? Bulls
b) Pokemon Daily Chart Tailed Bar reversal poking the 21-Day EMA.
c) P. Sar on the Daily Chart is Buyers day!
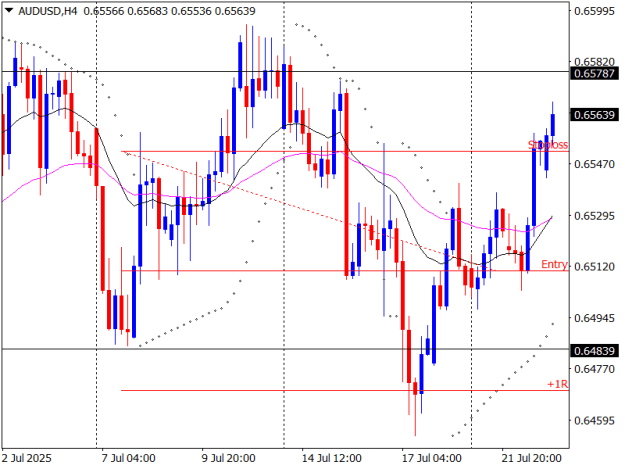
**Entry on 4-Hour chart done as it forms a new bullish channel with the 21-Day EMA above the 50-Day EMA on the 4-Hour Chart.
**The trade went a bit higher then came back all the way down nearly hitting my stoploss. I decided that i will not close it manually and will not interfere with it and let it be and give the trade room to breathe.
Alaaas, after another day it went again up and did not hit my SL, its a matter of just entering and placing your stoploss at a strategic level (checking also rounding off of market prices).
CLOSING TRADES MANUALLY BEFORE THEY HIT YOUR STOPLOSS IS DENYING MY TRADING EDGE A CHANCE TO PLAY OUT ITS TRUE WIN-RATE!!


My Confluence Factors include:
a) DAILY CHART TREND (MARKET STRUCTURE): The market is forming a fresh return higher after failing to go back all the way down to 0.5544 indicating that buyers have resumed powers taking the price to close higher above the 0.5692 resistance.
B) RESTRACEMENT**Bow and Arrow Concept: It then pulled back and retraced to the 21-Day EMA & the resistance now turned support at 0.5692 poking it and forming a bullish small tailed bar on the daily chart. The quality of the set-up was not the perfect hence was cautious and risked less than 1%.
C) DAILY CHART LEVEL: Price formed a Daily Chart BULLISH TAILED BAR THAT POKED THROUGH THE 21-DAY Daily Chart EMA LEVEL; The 8-Day EMA Level was crossed above the 21-Day EMA forming a bullish channel on the Daily Chart and even the P.Sar Dots supported this move.
D) DAILY CHART SIGNAL/CATAPULT/POKEMON: BULLISH TAILED BAR poking through 21-day EMA.
Other Thoughts:
a) Which Side of 21-EMA is the price? Bulls
b) Pokemon Daily Chart Tailed Bar reversal poking the 21-Day EMA.
c) P. Sar on the Daily Chart is Buyers day!
**Entry on 4-Hour chart done as it forms a new bullish channel with the 21-Day EMA above the 50-Day EMA on the 4-Hour Chart.
**The trade went a bit higher then came back all the way down nearly hitting my stoploss. I decided that i will not close it manually and will not interfere with it and let it be and give the trade room to breathe.
Alaaas, after another day it went again up and did not hit my SL, its a matter of just entering and placing your stoploss at a strategic level (checking also rounding off of market prices).
CLOSING TRADES MANUALLY BEFORE THEY HIT YOUR STOPLOSS IS DENYING MY TRADING EDGE A CHANCE TO PLAY OUT ITS TRUE WIN-RATE!!
Attached Image (click to enlarge)
Attached Image (click to enlarge)