Hi
I have a method that requires no indicators
basically you use a 30 minute chart
what do i need to see ?
up candle followed by a down candle is a anchor point high, down candle followed by up candle is anchor low , i then want to see open close high and low away from that anchor point then wait for the price to pullback and hit the anchor point - 1 pip
enter and hold for 10 pips
exit is a 30 minnute closoes past an anchor area pullbakc area
hope its clear
i use EU UC AU EJ EA GU
I will post some examples
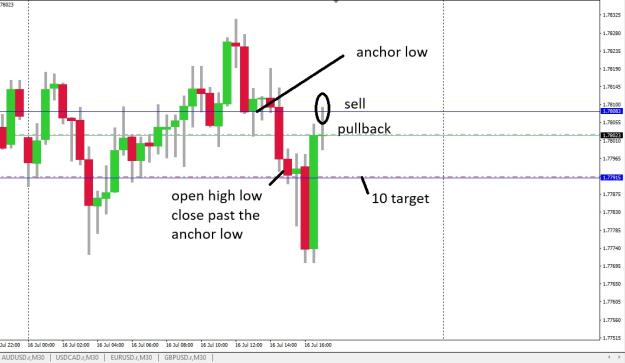