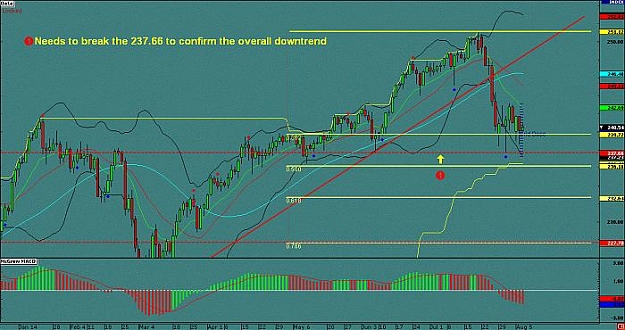
DislikedThere is a descent line running down the peaks.. current level is around 240.85. You can see it, for example, by drawing a line down the recent peaks in 8 hour charts.
In my opinion, it is very unlikely that price will rise above this descent line.Ignored
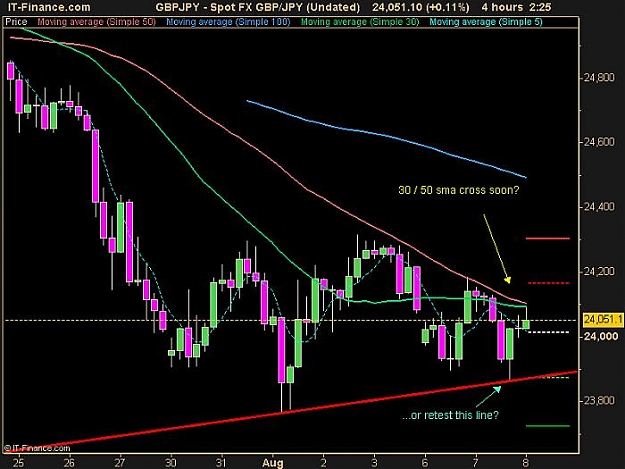
 Auslanco - GBP/JPY and GBP/USD (newstrade)
- #4,773
- Aug 7, 2007 10:16pm Aug 7, 2007 10:16pm
- Joined Feb 2007 | Status: Trade @ your own risk | 6,628 Posts
- #4,774
- Aug 7, 2007 10:25pm Aug 7, 2007 10:25pm
- Joined Nov 2006 | Status: Dubai | 11,493 Posts
Trade what you see, not what you think.
- #4,779
- Aug 7, 2007 11:32pm Aug 7, 2007 11:32pm
- Joined Feb 2007 | Status: Trade @ your own risk | 6,628 Posts