Who was George Taylor?
According to Grok 3:
George Douglas Taylor was a grain trader on the Chicago Board of Trade (CBOT) in the mid-20th century, best known for developing the Taylor Trading Technique, which he detailed in his 1950 book, The Taylor Trading Technique. Often called the "Book Method," his approach has been a favorite among swing traders for over 75 years, with advocates like Linda Bradford Raschke praising its timeless principles. Taylor’s core belief was that markets move in a predictable three-day cycle—Buy Day, Sell Day, and Sell Short Day—driven by what he termed "market engineering." He argued that large players manipulate price action to trap less-savvy traders, creating false moves that smart traders can exploit.
His method focuses on identifying this rhythm to anticipate market turns. On a Buy Day, after 1–3 days of decline, you’d look to buy near the previous day’s low as the market rejects lower prices. A Sell Day follows, where the market often exceeds the Buy Day’s high but fails to sustain, offering a chance to sell. The Sell Short Day anticipates a decline, often after an opening gap higher, signaling a shorting opportunity. Taylor also emphasized swing highs/lows, residual momentum (where prices often overshoot the prior day’s extremes), and calculating key levels like the "rally number" (today’s high minus yesterday’s low) to define support, resistance, and trading zones.
Taylor’s approach is all about timing within this 2–3 day framework, ignoring news or fundamentals and focusing purely on price action, typically on a daily chart. While his book is notoriously hard to read due to its dense style, the concepts remain powerful for traders who can master the cycle, offering a structured way to trade with discipline and capitalize on market rhythms.
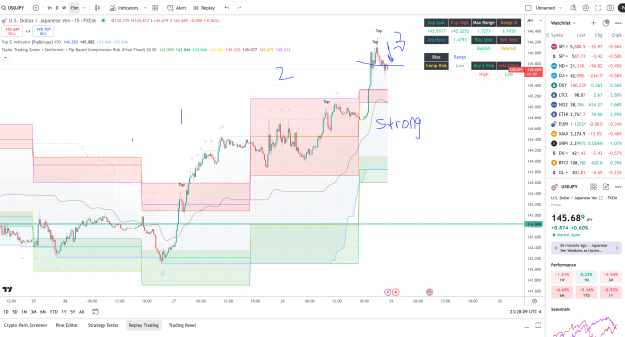
My own take: Taylor correctly identified that consecutive two day trends frequently reverse on the third day. I worked with AI to create an indicator made for TV which displays the Taylor Zone, resistance and support areas, main support, main resistance, and Pivot breakout levels. I look for clean patterns of two day trends, which include an HH, or LL, not just the candle body, but the body plus the actual highs or lows, so that there is no mistaking the pattern. I have observed that you can have let's say an up day, with an interim square day, where price doesn't do much in terms of open/close price, and then another up day. and this forms a valid pattern. Or if the second day was very small, or moved the candle body up but not the highs or lows, then I would look at that as a square day, and wait to see if we get another up day after that. So in these cases, day 2 becomes day 3, and we look to trade on day 4. Whereas normally, you look to trade on day 3.
So if you get into day three with a valid pattern, you can generally get one of 3 outcomes. The first one is weakness, the pair refuses to push higher (assuming uptrend), and it just meekly sells off. The second one is strength, price continues up near the breakout pivot, or even breaks through it. And the last one is stubbornness. Price sells off but slowly, kicks up often as it does, and won't give a full mean reversion to support.
You can trade the 1st or second responses, weakness or strength, but the third, stubbornness, is a sign that price wants to continue with the current trend. You might want to scalp the highs on a day like that, but don't get caught holding the bag.
Basically on day 3 you just want to be patient, see which response the market is making, and act accordingly. Also be aware of fundamentals, the possible formation of Supertrends, like 6 or 7 consecutive day moves, and avoid them. If price breaks the reversion pattern on day 3 or 4 as the case may be, then possibly you are getting into a Supertrend. But this will always be the less frequent outcome. What else can I say? Let's look at some trades.
Also I can say that I'm not really a big believer in Taylor's ideas of market manipulation. I think its just down to perceived value of the asset within the given time frame and the need for profit taking. Some pairs mean revert better than others. I like EU, UJ, GJ, A/CHF, EZ, GZ, UCHF, EA, don't like AZ, AU, GU, GA
According to Grok 3:
George Douglas Taylor was a grain trader on the Chicago Board of Trade (CBOT) in the mid-20th century, best known for developing the Taylor Trading Technique, which he detailed in his 1950 book, The Taylor Trading Technique. Often called the "Book Method," his approach has been a favorite among swing traders for over 75 years, with advocates like Linda Bradford Raschke praising its timeless principles. Taylor’s core belief was that markets move in a predictable three-day cycle—Buy Day, Sell Day, and Sell Short Day—driven by what he termed "market engineering." He argued that large players manipulate price action to trap less-savvy traders, creating false moves that smart traders can exploit.
His method focuses on identifying this rhythm to anticipate market turns. On a Buy Day, after 1–3 days of decline, you’d look to buy near the previous day’s low as the market rejects lower prices. A Sell Day follows, where the market often exceeds the Buy Day’s high but fails to sustain, offering a chance to sell. The Sell Short Day anticipates a decline, often after an opening gap higher, signaling a shorting opportunity. Taylor also emphasized swing highs/lows, residual momentum (where prices often overshoot the prior day’s extremes), and calculating key levels like the "rally number" (today’s high minus yesterday’s low) to define support, resistance, and trading zones.
Taylor’s approach is all about timing within this 2–3 day framework, ignoring news or fundamentals and focusing purely on price action, typically on a daily chart. While his book is notoriously hard to read due to its dense style, the concepts remain powerful for traders who can master the cycle, offering a structured way to trade with discipline and capitalize on market rhythms.
My own take: Taylor correctly identified that consecutive two day trends frequently reverse on the third day. I worked with AI to create an indicator made for TV which displays the Taylor Zone, resistance and support areas, main support, main resistance, and Pivot breakout levels. I look for clean patterns of two day trends, which include an HH, or LL, not just the candle body, but the body plus the actual highs or lows, so that there is no mistaking the pattern. I have observed that you can have let's say an up day, with an interim square day, where price doesn't do much in terms of open/close price, and then another up day. and this forms a valid pattern. Or if the second day was very small, or moved the candle body up but not the highs or lows, then I would look at that as a square day, and wait to see if we get another up day after that. So in these cases, day 2 becomes day 3, and we look to trade on day 4. Whereas normally, you look to trade on day 3.
So if you get into day three with a valid pattern, you can generally get one of 3 outcomes. The first one is weakness, the pair refuses to push higher (assuming uptrend), and it just meekly sells off. The second one is strength, price continues up near the breakout pivot, or even breaks through it. And the last one is stubbornness. Price sells off but slowly, kicks up often as it does, and won't give a full mean reversion to support.
You can trade the 1st or second responses, weakness or strength, but the third, stubbornness, is a sign that price wants to continue with the current trend. You might want to scalp the highs on a day like that, but don't get caught holding the bag.
Basically on day 3 you just want to be patient, see which response the market is making, and act accordingly. Also be aware of fundamentals, the possible formation of Supertrends, like 6 or 7 consecutive day moves, and avoid them. If price breaks the reversion pattern on day 3 or 4 as the case may be, then possibly you are getting into a Supertrend. But this will always be the less frequent outcome. What else can I say? Let's look at some trades.
Also I can say that I'm not really a big believer in Taylor's ideas of market manipulation. I think its just down to perceived value of the asset within the given time frame and the need for profit taking. Some pairs mean revert better than others. I like EU, UJ, GJ, A/CHF, EZ, GZ, UCHF, EA, don't like AZ, AU, GU, GA