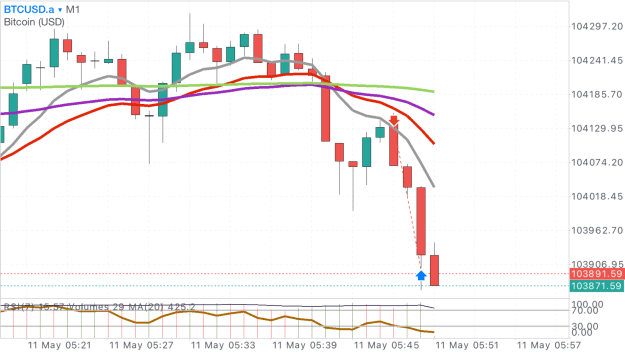
M1 XAUUSD - first two trend continuation trades failed, so waited for a countertrend opportunity bounce off ema200 then the trend continued before pulling back again!
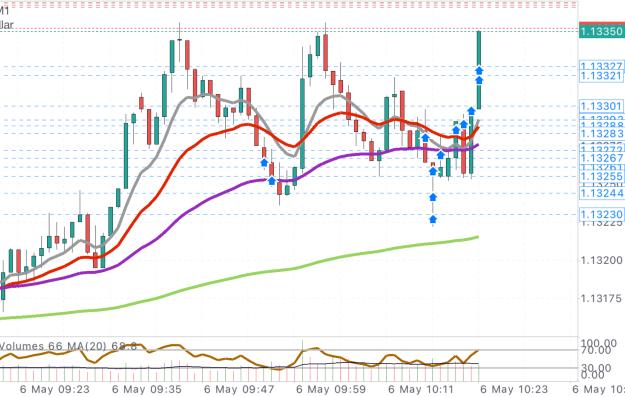
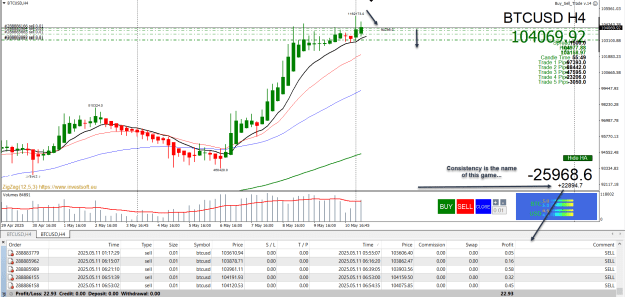
I've changed brokers to enable better spreads, but unfortunately they use MT4, not MT5, so I've manually drawn in my trades for journalling purposes. Here is AUDUSD countertrend scalps taken just now.
Attached Image (click to enlarge)
We don't see things as they are - we see things as we are.
I've changed brokers to enable better spreads, but unfortunately they use MT4, not MT5, so I've manually drawn in my trades for journalling purposes. Here is AUDUSD countertrend scalps taken just now. {image}
Ignored
Its the same with TradingView, sucks having to draw them in.
{quote} seriously? TradingView has all kinds of tools for drawing, you can set favorites bar, copy and paste fast
Ignored
Attached Image (click to enlarge)
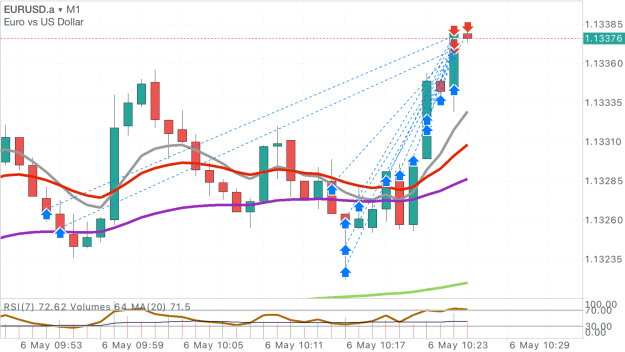
There are my trades from yesterday. You cant tell which two arrows are a pair, you also cant see the entry/exit unless you hover over the arrow. So yeah, seriously.
Wow, this was a lot more annoying to port to MT5 than I thought. MT5 is really very finicky. Distance from MA v1.3 Press "1" to create Horizontal Line in the sub-window. Press "o" to toggle Object Descriptions. Press "i" to toggle alert for selected Horizontal Line. When the Distance (Pips from MA) reaches the line, an alert is triggered and cleared. Alerts are 4 types Push Popup Sound Bold (Line turns bold - cleared when you toggle alert again) {file} {file} {image}
Ignored
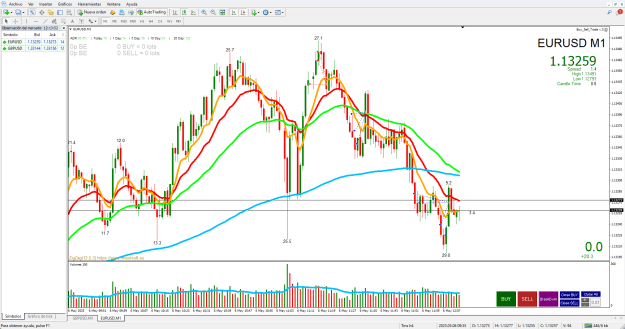
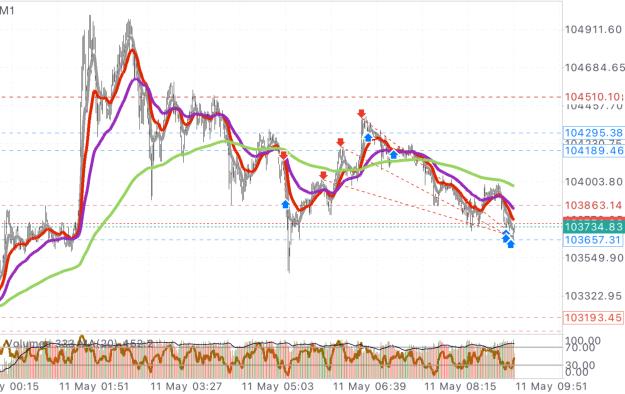
Is that on purpose or its a bug? So mt4 version got logic that if candle close closer to MA then indicator shows it. mt5 version as u can see (red/green candles) shows that even candle closed bullish and got closer to MA, indicator shows that price not close to MA even further from ma. Thanks for indicator once again.
{quote} Is that on purpose or its a bug? So mt4 version got logic that if candle close closer to MA then indicator shows it. mt5 version as u can see (red/green candles) shows that even candle closed bullish and got closer to MA, indicator shows that price not close to MA even further from ma. Thanks for indicator once again. {image} {image}
Ignored
You're welcome for the indicator.
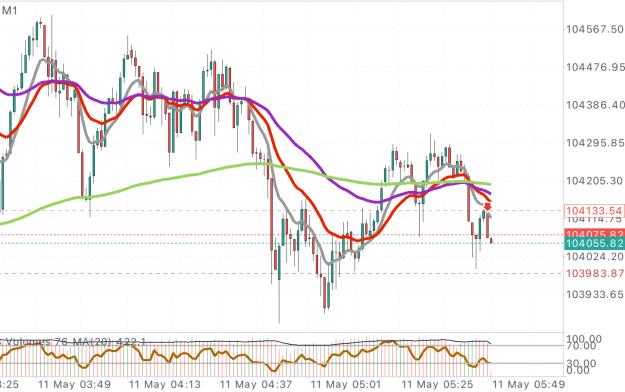
The Indicator does not measure close price. Instead, it measures the high and low of a candle.
If High > MA, Green Histogram will show High Price
If Low < MA, Red Histogram will show Low Price
Hence, you will see green and red bars on the same candle if the candle has a high > MA and low < MA, which happens
Current Distance = current price distance (current close) from MA
I don't seem to find any difference between the MT4 and MT5 versions unless you can be more specific. MQL5 is a lot stricter than MQL4 so sometimes the code logic doesn't translate well. It took me a ridiculous amount of time to fix one particular logic.
{quote} You're welcome for the indicator. The Indicator does not measure close price. Instead, it measures the high and low of a candle. If High > MA, Green Histogram will show High Price If Low < MA, Red Histogram will show Low Price Hence, you will see green and red bars on the same candle if the candle has a high > MA and low < MA, which happens Current Distance = current price distance (current close) from MA I don't seem to find any difference between the MT4 and MT5 versions unless you can be more specific. MQL5 is a lot stricter than MQL4...