GBPUSD Weekly Technical Outlook
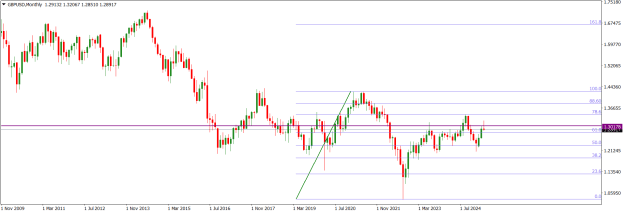
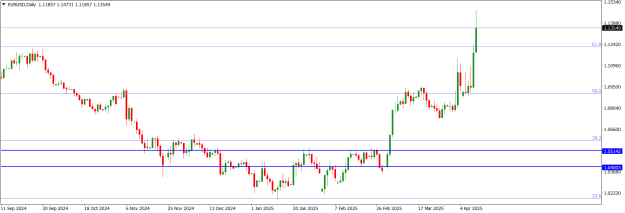
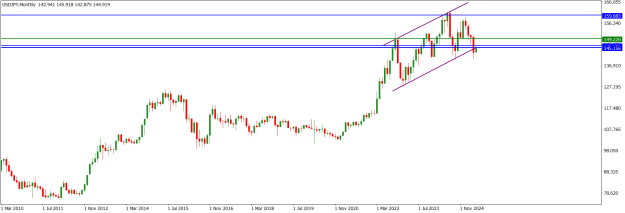
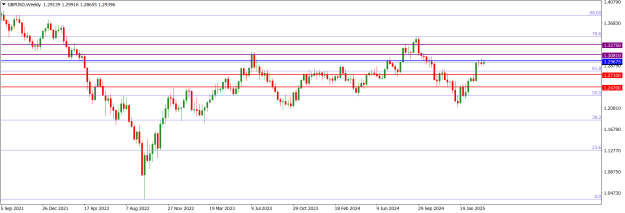
The GBPUSD market operation on the weekly time frame remains sideways at the 1.29675 horizontal resistance area. Last week, the market operation printed an indecision candlestick in the area, the third in three consecutive weeks.
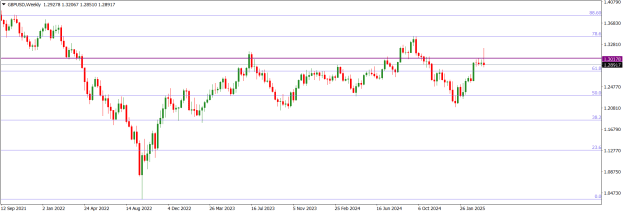
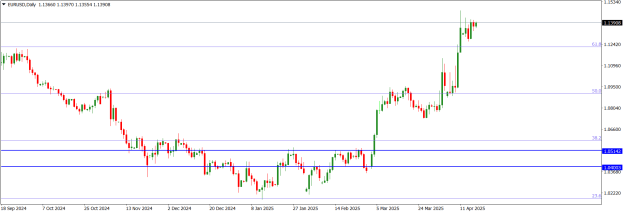
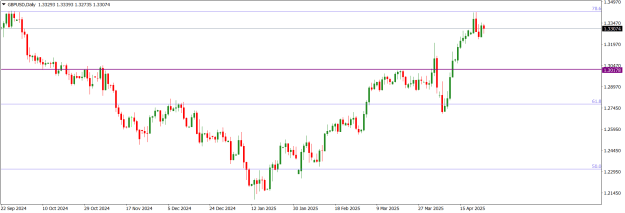
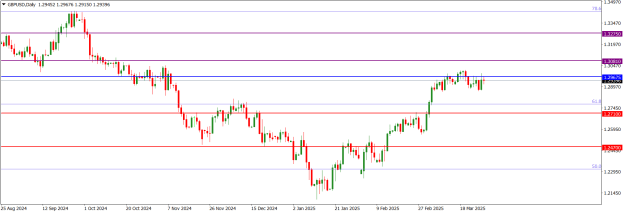
The GBPUSD price action on the daily time frame is sideways at the 1.29675 horizontal resistance area. The preceding technical impulse is bullish, and we may still see further northward market engineering to an intra-day area of value. Nevertheless, the dominant technical structure is bearish.
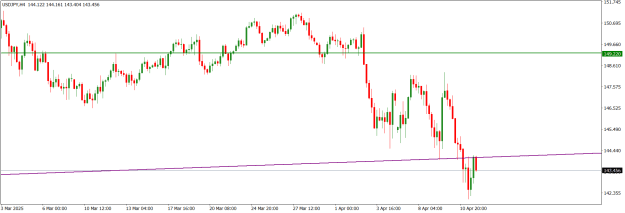
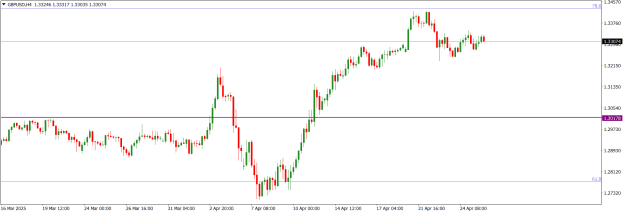
The GBPUSD price action on the H4 time frame is sideways. There was a bullish retest of the 1.29675 horizontal resistance on Thursday before the price action went sideways in the area. Recent technical prints favour northward liquidity engineering before a southward turnaround.

I may be wrong. Trade safe and prosper.
KP
The GBPUSD market operation on the weekly time frame remains sideways at the 1.29675 horizontal resistance area. Last week, the market operation printed an indecision candlestick in the area, the third in three consecutive weeks.
Attached Image (click to enlarge)
The GBPUSD price action on the daily time frame is sideways at the 1.29675 horizontal resistance area. The preceding technical impulse is bullish, and we may still see further northward market engineering to an intra-day area of value. Nevertheless, the dominant technical structure is bearish.
Attached Image (click to enlarge)
The GBPUSD price action on the H4 time frame is sideways. There was a bullish retest of the 1.29675 horizontal resistance on Thursday before the price action went sideways in the area. Recent technical prints favour northward liquidity engineering before a southward turnaround.
Attached Image (click to enlarge)
I may be wrong. Trade safe and prosper.
KP
Do your homework, follow the footprints of smart money