Disliked{quote} Hi Ata, i checked in to the daily chart, i don't know surely but i found that EU is forming inverted head and shoulders and it's like going to 1.16 - 1.17 incoming months. as friday daily candle closing above 1.0955. Would you please help to check according to your analysis to know if its valid or not? Thanks in advanced. {image}Ignored
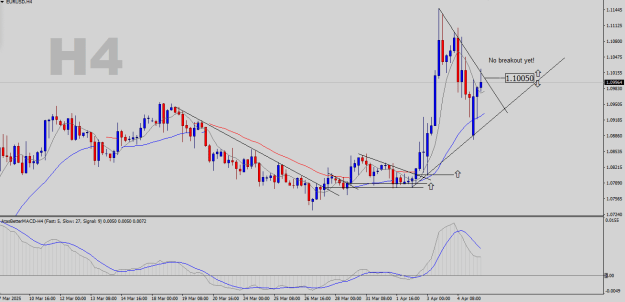
Instead, I better give you my overall thoughts based on the monthly chart below:
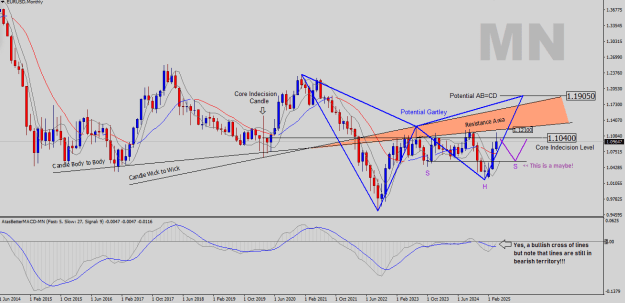
- Bulls are trying to climb higher and my MACD shows a bullish cross of lines BUT it is too early to tell if bulls can break above nearest resistance, which is strongly related with my core indecision level: ~1.1040... Write this level down because it will play an important role in coming days and weeks...
- For your Inverted H&S to play out, the resistance level I mentioned has to stop bulls and force bears for a last retest to form the missing shoulder (purple lines on chart), which I see as possible, but again we must constantly remind ourselves that nothing is a guarantee in trading...
- On the longer run, if bulls can finally overcome the resistance zone, which is really a wide zone, I also would look for a potential AB=CD rally which could cause a completion of a potential Gartley pattern. You see how everything falls into place... Only if all this plays out though... For now, these are only ideas... Intraday wise, we have to go step by step to see where this pair takes us...
- Since this is the monthly chart, give every mentioned level some proper flexing room and don't chase precision...
I hope it answers and puts some light into your thoughts...
Best wishes ![]()
Attached Image (click to enlarge)
Focus only on what truly matters!
12