GBPUSD Weekly Technical Outlook
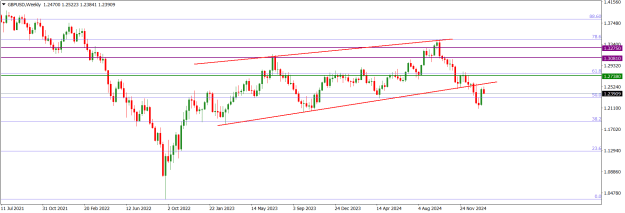
Last week, the GBPUSD market operation on the weekly time frame made a bullish retest of the 1.24790 horizontal resistance area. The area is between the 50/61.8 fib retracement zone of the bearish swing traceable to May 2021. The dominant technical structure is bearish.

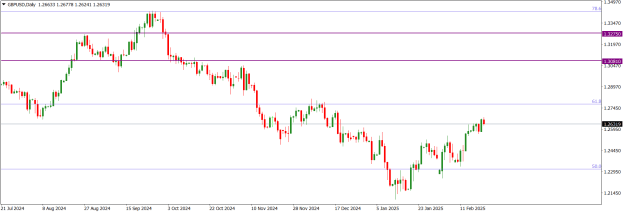
GBPUSD price action on the daily time frame is in a bullish corrective mode. On Friday, price action broke above a mini-area of consolidation to retest the 1.24790 horizontal resistance area. Although we may still see further northward market engineering, the dominant technical structure is bearish.

GBPUSD price action on the H4 time frame is making a bullish correction and presently sideways at the 1.24790 horizontal resistance. Nevertheless, we may still see further northward market engineering before a southward turnaround. The dominant technical structure is bearish

I may be wrong. Trade safe and prosper.
KP
Last week, the GBPUSD market operation on the weekly time frame made a bullish retest of the 1.24790 horizontal resistance area. The area is between the 50/61.8 fib retracement zone of the bearish swing traceable to May 2021. The dominant technical structure is bearish.
Attached Image (click to enlarge)
GBPUSD price action on the daily time frame is in a bullish corrective mode. On Friday, price action broke above a mini-area of consolidation to retest the 1.24790 horizontal resistance area. Although we may still see further northward market engineering, the dominant technical structure is bearish.
Attached Image (click to enlarge)
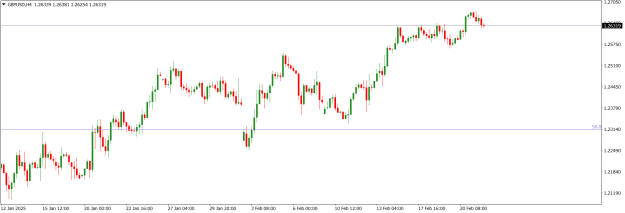
GBPUSD price action on the H4 time frame is making a bullish correction and presently sideways at the 1.24790 horizontal resistance. Nevertheless, we may still see further northward market engineering before a southward turnaround. The dominant technical structure is bearish
Attached Image (click to enlarge)
I may be wrong. Trade safe and prosper.
KP
Do your homework, follow the footprints of smart money
1