The zipped attachment is a wordpad written copy of Phillip's analysis of the EURUSD breakout trade for those who have trouble understanding spoken English. Good luck with it.
Ignored
Thank you very much. I appreciate it. I will post the 13 Summary Lessons text tommorow night.
Phillip
The zipped attachment is a wordpad written copy of Phillip's analysis of the EURUSD breakout trade for those who have trouble understanding spoken English. Good luck with it.
Joined Jul 2007
|
Status: Screw Long Term 5min For Life!
|1,259 Posts
Also I have really never drawn trend lines. Is there a good book that helps with this? I know the MACD very well and how to read it just need help with the trend lines. Thanks again.
Also I have really never drawn trend lines. Is there a good book that helps with this? I know the MACD very well and how to read it just need help with the trend lines. Thanks again.
Ignored
By what I know so far about drawing trendlines...
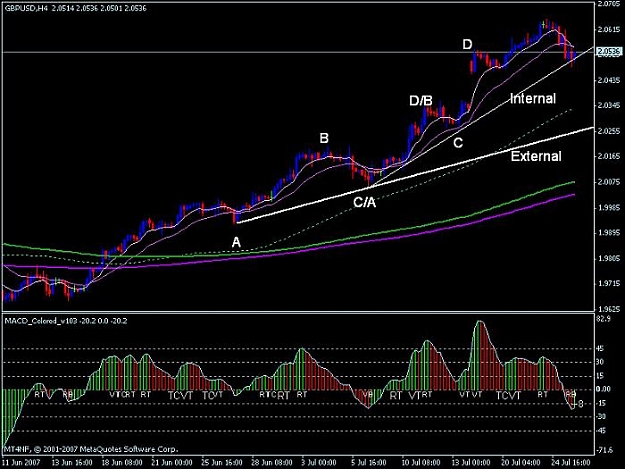
Trend lines most often also work to determine support/resistance levels. Previous support can become future resistance, and vice versa. You can draw them on any time frame. Longer time frames have trend lines that are strong s/r levels but you can also draw trend lines in between, meaning in shorter time frames. Trend lines in longer time frames are External, and trend lines in shorter time frames are Internal. Externals are stronger than Internals. An External bullish trend line, can have Internal bearish trend lines. Always be aware when approaching the external trend line, since the internal trend line may change direction.
To the point... Before you draw them, you have to identify the general direction of the market up, down, sideways, and you also have to identify the ABCD pattern. Well, that's the way I do it. In an uptrend, A is the lowest low, B is a new high on that uptrend, C is the next higher low, and finally D is a higher high. Draw a line from A to B and you have your trend line. The opposite holds for a downtrend line but with the same principle. As the trend continues (if it does), C becomes A, D becomes B, and then you would have a new C and D. Get it?
Can you help me out with the MACD please?? jeje, I'm having trouble with this one.
You are all very welcome! The following zipped attachment is a written wordpad copy of Phillip's analysis of the GBPUSD breakout.
There's an icon in the attachment that says "thumbs." Where it came from is a mystery to me, but it has nothing to do with Phillip's analysis, and they came out okay. Strange things happening?!!
Also I have really never drawn trend lines. Is there a good book that helps with this? I know the MACD very well and how to read it just need help with the trend lines. Thanks again.
Hello Phillip, welcome back . very interesting PDF. Please dont feel dishearted ,. your support is amazing. You put so much effort into making sure we understand the market motion etc. i just listened to this mp3 and saw the charts. will post my analysis later tonight. You have taught us sooooo much.
Thankyou and best wishes,
Nadia.
P.S also thankyou olddog for typing up phillips mp3. you must be suuuuper fast !!!!
Trend lines most often also work to determine support/resistance levels. Previous support can become future resistance, and vice versa. You can draw them on any time frame. Longer time frames have trend lines that are strong s/r levels but you can also draw trend lines in between, meaning in shorter time frames. Trend lines in longer time frames are External, and trend lines in shorter time frames are Internal. Externals are stronger than Internals. An External bullish trend line, can have Internal bearish trend lines. Always be aware when approaching the external trend line, since the internal trend line may change direction.
To the point... Before you draw them, you have to identify the general direction of the market up, down, sideways, and you also have to identify the ABCD pattern. Well, that's the way I do it. In an uptrend, A is the lowest low, B is a new high on that uptrend, C is the next higher low, and finally D is a higher high. Draw a line from A to B and you have your trend line. The opposite holds for a downtrend line but with the same principle. As the trend continues (if it does), C becomes A, D becomes B, and then you would have a new C and D. Get it?
Can you help me out with the MACD please?? jeje, I'm having trouble with this one.
Keep on pippin!
Ignored
If you have access to Bill Williams AO put that on a chart it will help clear the MACD false moves, what I am looking at now is when MACD goes red or green wait for AO to go the same color. Only problem is it's a little slower but it does keep you out of some bad / not safe trades. What about MACD do you want to know?
Joined Jul 2007
|
Status: Screw Long Term 5min For Life!
|1,259 Posts
Take a look at this, look for both AO and MACD to go green / red at the same time. MACD leads the AO, AO has less fakes. Just trying to add a filter to it.
Hi Phillip, thanks again for your great teaching. On your Eur$chart for today daily wrap up, would you explian what is the other indicator above your MACD? i appreciate it
|
Joined Apr 2005
|
Status: Cruising The Outer Rim...
|2,175 Posts
Hey folks...Work is taking my out on the Big Blue for about two weeks and won't be back here until the third week of August. No sharks this time Donna, just some grouper and snapper stuff...
Anyway, I'm thinking if anyone else is thinking, "What happened to the next bounce to the upside at the bottom of the 1hr channel on the EUR$??? It fell like a brick right through it!!!" A few posts back I noted that I had a wacky feeling about things for some reason. As the price action on the 1hr was heading to the support line...again...I didn't do anything. It may have been that long candle that closed below the support line (channel bottom) that kept me away. But, the MACD turned up (to green) just the same but priced stalled. Then I noticed, this is after the fact, that the MACD tops were getting progssively smaller as price on the 1hr was still making new highs. So, there was some bearish divergence coming into play as well. The same thing was happening on the 4hr as well. Also, on the 4hr channel price had made its way through support of the channel for the first time = weakness??? But, back to the bearish divergence on both timeframes...When you have the same signal, setup, formation, or deja vue (spelleeng?) indicator on multiple timeframes it's usually a very strong signal to follow the rules of that signal...In this case to sell. BUT...The 4hr was above the 89 and we were still bullish. That would have been a tough call per the rules. The MACD was showing 'another' very weak Rt because it was below the 0.15 line. This was the 5th or so weak Rt in a row but the 8/21 were too close for any real profit targets also. Hmmmm, the take home message.....1) Mulitple timeframe signals. 2) MACD divergence. 3) Price breaking through support (or resistance) for the first time in a very lonnng time.....It's always easy to see this after the fact. But, it's easier to remember it the next time this occurs...
July has been a good month. The USDJPY was good to me, lot's of entries and pips in the bank. I've got no open positions and I have lots to do before the ship leaves the dock so no trading for the rest of the week per Phillip's 4hr method. I think there's an eco news release on Friday and I may watch that but that'll be it until mid August. I may poke my nose in here a few times before I leave. Soooo, don't force your trades and as Phillip has stated, "Let the market come to you."
& as your post was written after price bounced back up to ~2.0611 and traveled back through the hourly 89....I'm guessing you aren't upset that I warned Nadia to leave the 200 pips on the table? I'm just looking at the charts now (I took last night off) and was extremely surprised to see the scenario played out as described (Phillip has taught market motion well, eh?) .
& Nadia....where you brave & did you go short w/the move through the 89 (w/the retest on next candle?) or do I feel guilty? (Gosh MACD even confirmed on every time frame, when price moved solidily through H1 89... hehe.)... IMHO (and this is just my opinion) I still don't think it is a safe bet to short Cable (notice it is sitting on the daily 8 now?) even though it could lower still, its still risky to short. But what do I know?
hello friends
i have question
Can i use 4H macd system & default Set in lower time frame 30M & 1H and use patterns like zero line , trend countinuation , trend reversal zero back & rounds & double top & Etc that philip says in e-book
Or you offer me use some of them ?
many thanks
Ignored
Hi 919....this may have been answered already.....
You will most likely get whipsawed to death trading every hourly MACD signal. If you decide to trade from Hourly, make sure you plan the trades w/TP's on hourly scale and think about only trading in direction of the 4 hour signal (using H1 for TC detection from H4 is in harmony w/method....trading signals exclusively from H1 isn't). I, personally, think you are asking for trouble trading 30 min. signals, especially if you are not Very confident in using this method of trading. Too easy to start flipping positions often and overtrading. The H1 charts are great to see what is happening in critical decision points from H4 charts and are great multi entry signals when pairs are trending (look at all the moves through the 8/21 MA's on Cable lately....). Practice with the method first and see how it works for you. You are the only one who knows if it can be profitable for you. Just don't mix TF when trading (i.e. planning on H1 but using H4 targets).
Hi pips, You dont have to feel guilty at all , we know that our decisions are our own. I went with my gut feeling and went for a short at zero break for 35 pips. ( even though i said earlier i might not). now i am waiting for a nice bounce off 8 ma on 4 hour. the macd has given a TC on 4 hour like 20 min ago, but current candle retracing a bit, and finding resistance at 8 ma on one hour. so will watch very carefully to see where to enter. also have my eyes on the daily around 8ma. Thanks for your updates,
Best wishes,
Nadia.
Ignored
I like the 0 breaks! Also, for this uptrend, it corresponded w/the end of the uptrend on the 4 hour MACD for the longer term trend...Now my lines say it is on until -.0002....then back to uptrend. I'm attaching my chart for anyone interested...see the red line on the MACD in positive territory...that is when I wrote saying MACD daily said short post (MY daily MACD line closed below too)...and the lower red line is at about zero line was just for a longer term upmove...just something I play with on Phillips system that gives me a feeling of confidence...even though I'm not shorting...yet You are doing great analysis work!!! Keep it up!!!! Happy to hear about your pipage!
I expected the EURO breakout due to the strong divergency and had a wonderful trading plan both on short and long, but I didn't executed it . The reasons are: move was very strong, I waited for a retrace, but it didn't happen. But the main cause was my fear! I had already one loss waiting for breakout, so wanted some more and more conformation. When I had it, it was too late . Next trader's mistake - don't let the past failures interfere in your present work!
Move on... Euro has gone through 89MA and stopped at 1.3700 price level giving a RB on MACD. The rule tells us that after going through the 89 it might go and test 21 again. But on it's way there is 89, pivot and 23.6 Fib number, besides 21 can travel to this level as well.
first of all I want to thank Phil once again for commenting our trades.
My point of view of the market is the following:
Euro:
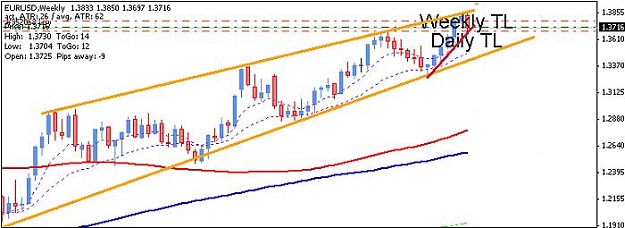
Weekly Chart:
we are in a uptrend.
Attached Image (click to enlarge)
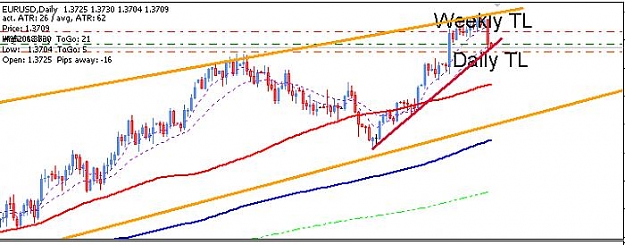
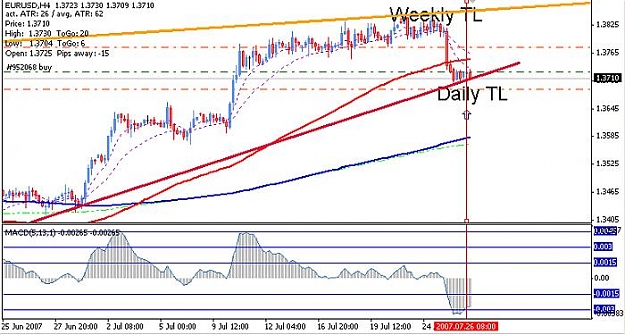
Daily Chart:
Attached Image (click to enlarge)
4h Chart:
Price went down through the MA80, and rest now on a daily ressitance line.
at the same moment we see a round bottom on the MACD, so I decided to go long.
Joined Jul 2007
|
Status: Screw Long Term 5min For Life!
|1,259 Posts
Looks like a long @ .720 on the euro. Macd looks good stop loss @ .690 nice little support there. Just posting my thoughts and taking SS of the chart to see what I did right / wrong. This is paper only
I expected the EURO breakout due to the strong divergency and had a wonderful trading plan both on short and long, but I didn't executed it . The reasons are: move was very strong, I waited for a retrace, but it didn't happen. But the main cause was my fear! I had already one loss waiting for breakout, so wanted some more and more conformation. When I had it, it was too late . Next trader's mistake - don't let the past failures interfere in your present work!
Move on... Euro has gone through 89MA and stopped at 1.3700 price level giving a RB on MACD. The rule tells us that after going through the 89 it might go and test 21 again. But on it's way there is 89, pivot and 23.6 Fib number, besides 21 can travel to this level as well.
Ignored
Hi Ira and everyone,
I'm still working my way through the thread and learning the process but I just wanted to agree with your assessment of the EUR Ira. Since you posted this, the 21 and the 89 are now just 7 pips apart. Also, the 23% fib coincides with a 38% retrace of the down move, and one for good measure, all these things line up with an old support low back on the 18th. Along with the daily pivot @ 1.3747 and the weekly M1 @ 1.3749, that makes 7 reasons to expect strong resistance @ the 1.3750 area. No guarantees, but a bounce off that level is favorable.
Thanks to all who help here; I'm looking forward to being one of you soon. At this time I have reached post # 3871 in my read through. I feel like I did in school when I had to read "War and Peace".