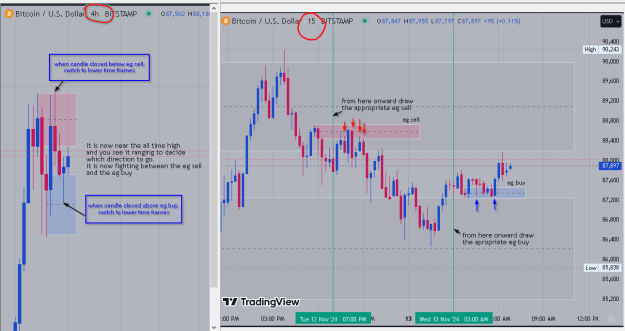
DislikedHello Inthebox, First of all I would like to thank you for sharing your method with us. Although this method seems difficult and complicated for me, I'm trying my best to understand it slowlyOn screenshot below I try to draw engulfing zones on BTCUSDT H4 chart, please take a look. Did I draw it correctly? And how should I make my analysis based on it? Is it if Bullish EG (H4) ² fail, price will try to reach Bullish EG (H4) ¹? and if Bearish EG (H4) ¹ fail, price will continue its rally? {image}
Ignored
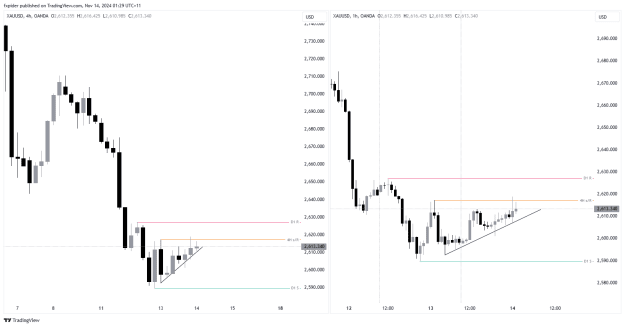
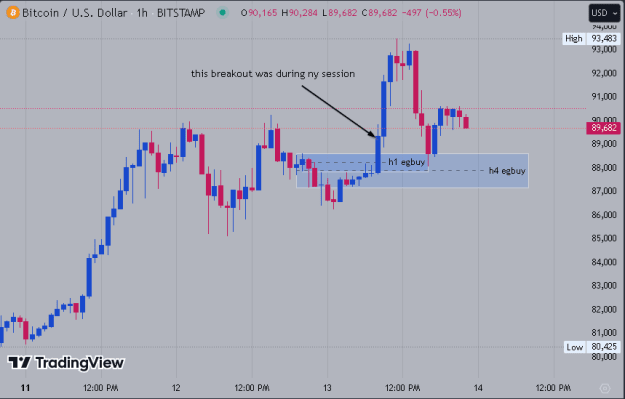
my comments in the charts. this is as simple as i can do.
Attached Image (click to enlarge)
ITB - Seeing Orderliness amongst 'Randomness'
4