DislikedHoboy I hope I don't get in trouble for these distractions and Hobbies
Yes, I admit everything, I use that tool for visualization often.
It is however simply to show spots on the chart which have possible price projections. Things work like this:
Head and shoulder patterns(a lot of pin bars are compressed forms of these):
They have a head and neckline. Initial target for a move out once that neckline is broken and sometimes revisited is the size of the top of the head to the neckline. It is measured and then "projected" from the neckline on.
This doesn't always match up or work, but if I see it coincide with s/r or other fibs etc, it's just something I am trying to watch and learn from.
This guy here
http://www.trading-naked.com/headand...ersREVERSE.htm
http://www.trading-naked.com/HeadandShoulders.htm
uses them for example, but the page is a bit messy.
There's also info at
http://stockstoshop.com/headandshoulders.htm
and also for wedges and similiar. BUT IGNORE THE INDICATORS SECTION
This one also has a really nice essay on it.
http://www.kcifinance.com/CT01.710.html
And there's more about price projections here, too
http://www.forex-trading-software.co...t-patterns.htm
and
http://www.thestockbandit.com/Site-Map.htm
looks cool.
Other stuff is Elliot Wave, but that's far too complex. If you want to look into that sort of thing you can google "simple ABC correction" and "isolation approach", but it will not yield anything tradeable. Hobbies and pastimes, as I said.
Also, a giant word of caution: These projectons mean NOTHING on their own. NOTHING.
They are for ME just a general guide to say "hey, be careful to look what price might do once it gets here".
That's all. Nothing more.
Exiting blindly is the same as cutting your profits short and strongly advised against.
Hope this answered your questionIgnored
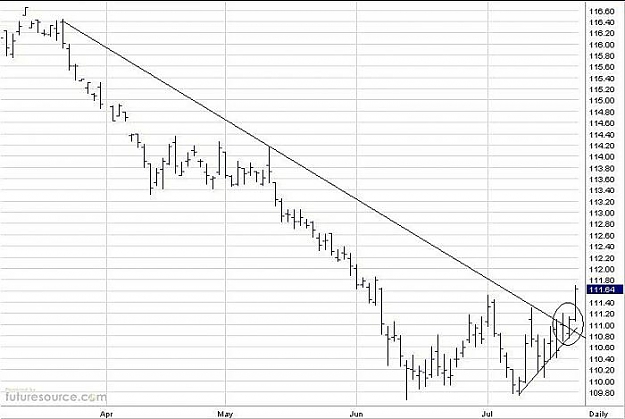
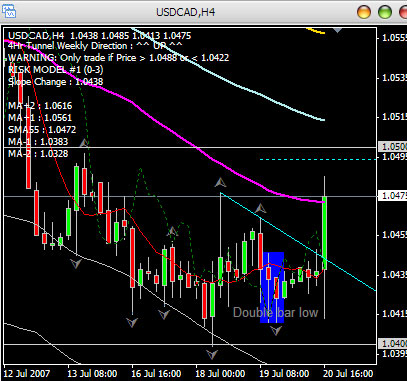
Also find my USD/JPY short on 4hr, its off a pb, any comments are most welcome.
Attached Image