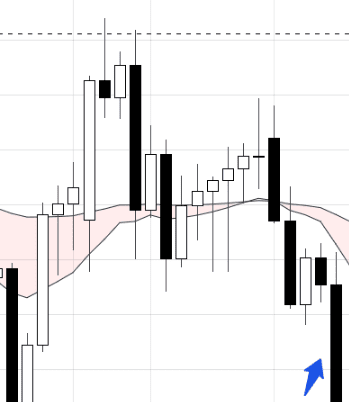
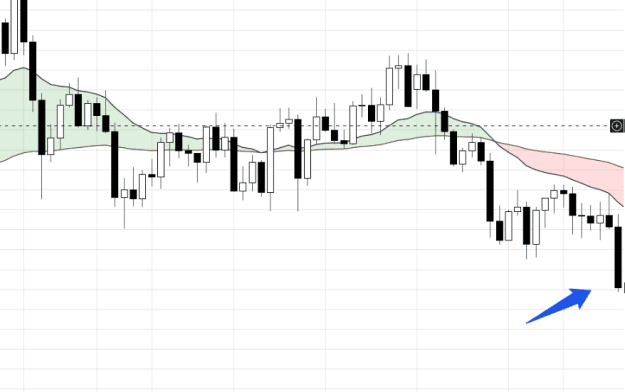
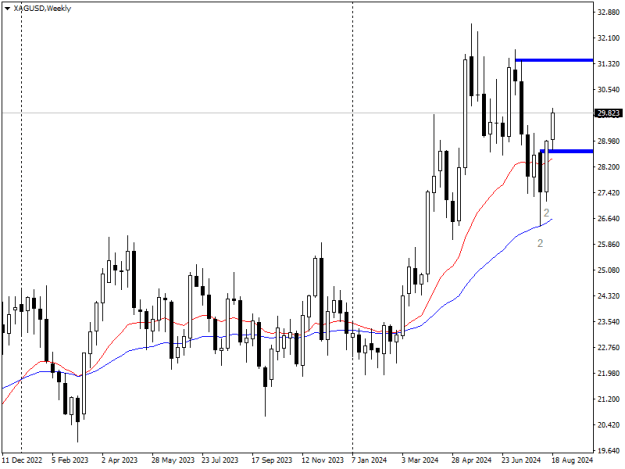
For tomorrow I like situation on silver, BB shows up like pinbar, BOSS also up after 22 reversal and worker now shows 22 reversal after shadow and BOSS reversal was tested
1
MY PASR journey Based on Strat's PASR Trading 76 replies
M5 PASR Trend Trading Strat 95 replies
My PASR Trend Trading Journals 3 replies
A young trader's road to profitability - PASR trading - Live 11 replies
Fibs trading and PASR 0 replies
DislikedTerry, Thanks in advance for taking sometime in answering my question, still trying to cement my understanding of MTF analysis. Posted a series of three images here.. So this is an old chart, last candle on each image is obviously what we are assessing. "Big Boss" {image} "Boss" {image} "Worker / Entry" {image} This would be a set-up I normally would really like to see, BB is showing some significant downward price action, the Boss is corresponding to that downward move and our Worker / Daily shows what I assess as a good opportunity to enter. Also,...Ignored
Disliked{quote} Everything is correct. What is missing is SR from past PA on the left to asses if there is room to move or not You can use any timeframe as long as you understand the power of higher frames. You are not limited to only 3. But you can not really count on m5 going in the direction of the monthly for example. Monthly/4H are still relevant to each other if barely so PS notice that after a big move on the monthly the direction is still the same on the daily and weekly {image} On a strong move, any entry close to the shadow is great. You dont...Ignored
Disliked{quote} Bist, Thanks for taking the time to reply.. I know from reading the forum you were crushing the smaller TFs too (for the first images, price moved lower and you could have closed for a 1:2 winner). If you don't mind me picking your brain a little further, is it mandatory that the shadow of all three be in confluence with each other? Like in this case we have clear downtrends in Monthly & Weekly, but you are correct the shadow is still technically green or bullish on the Higher Timeframes. Just making sure I am not taking any short cuts,...Ignored
Disliked{quote} PA is in a weird spot on this. I would pass for something better. if everything is aligned you get some monster moves when it keeps going up then everything is in alignment {image} {image}Ignored
Disliked{quote} One more... Weekly {image} Blue arrow shows where on Weekly our Worker entry would have been Worker {image} Blue arrow shows entry -- Price breaking out of support... I didn't post big boss but it was also displaying a "red shadow" and moving downward.Ignored
Disliked{quote} You are getting it Now you need to forward test and get experience doing it over and overIgnored
Disliked{quote} Bist, Thanks again for taking a look, going to post some live charts in the coming days and would appreciate your feedback and of course anyone else if they wish to chime in. Trading intraday isn’t going to happen due to my schedule, but I am curious, how do you like it? Are you trading exclusively intraday now or are you doing a combo of intraday and some higher TF stuff? Just interested in how you’re finding it.Ignored
Dislikedpart 1/2 Hello Friends The recent discussions around the higher time frames & the beginning of a new month has encouraged me to share my thoughts and what I would like to see eventuate in the index future markets for the month of September First of all, when I say "Index Futures" I am referring specifically to the ES and NQ CME contracts which are positively correlated 96% of the time. Intermarket correlation insights can be found here Here is the monthly chart of the 2 x contracts as at Sept...Ignored
DislikedTerry, Thanks in advance for taking sometime in answering my question, still trying to cement my understanding of MTF analysis. Posted a series of three images here.. So this is an old chart, last candle on each image is obviously what we are assessing. "Big Boss" {image} "Boss" {image} "Worker / Entry" {image} This would be a set-up I normally would really like to see, BB is showing some significant downward price action, the Boss is corresponding to that downward move and our Worker / Daily shows what I assess as a good opportunity to enter. Also,...Ignored
Disliked{quote} You seem to have the hang of it, however in this case a significant part of the downward move has already taken place so one should be looking for entry long before this. One thing to do is highlight the WCC at the top of your weekly chart and follow that. Also look at that huge shooting star on the weekly at the top. Signals on the higher time frames are much stronger than on the lower time frames. Regards TerryIgnored
Disliked{quote} Terry appreciate the feedback. One more question for you about how to develop exceptions for higher time frames? Specifically, I’m curious about cases like the GBP/CAD trade, where the setup looked great! but the monthly time frame was still bearish. I’d love to hear your thoughts on how to navigate those situations, because I loved that set-up too but would have been struggling with the monthly still being bearish. Thanks again for the insightsIgnored
Disliked{quote} Best way is probably to draw what we see in this case using control candles: When we see large candles in any time frame, there is the potential for a control candle to be in force and from my perspective the color of the control candle signifies the direction. In this case the BB control is green so bullish. {image} {image} {image}Ignored
DislikedJust checking in... So near support and resistance little turbulence on the left on the daily, both weekly and monthly bombing down, decent PA looking symbol here on daily chart... this chart is a few days old, cool to enter even when there is some initial turbulence, but lots of room on Weekly for price to move lower and is in conjunction with the last couple of month move? Big Boss {image} Boss {image} Worker {image} For clarity, that BEEB on the worker is what I am interested in... too aggressive here?Ignored