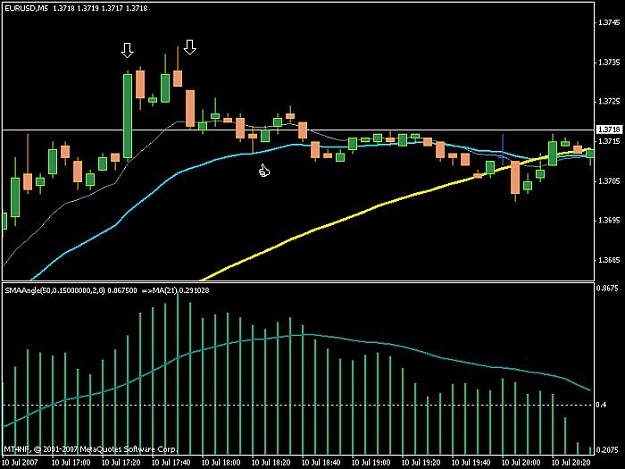
This is a much better example of the sort of pull-back to look for. In the blue rectangle, the price hit R2 and was engulfed by a large bearish candle. At first, not a good sign, as it indicated a potentially similar pull-back to the EUR/JPY one I showed you in the previous example. However, the price settled down to creeping sideways for a while, before starting to gently drop through the 10ema before starting to reverse mid-way between the 10ema and the 21ema. (There's even a very helpful little doji candle to light me on my way!) The first blue arrow indicates my entry trigger, my entry being at 1.3645. (The ADX is still around the 25 mark, with the +DI starting to rise......a positive sign.)
A nice sequence of candles took the price up to 1.3657, at which I exited the trade. (2nd blue arrow) Taking the spread into account, a nice 10 pip profit.
How very nice of Forex to provide me with two contrasting examples in such a short period of time!
A nice sequence of candles took the price up to 1.3657, at which I exited the trade. (2nd blue arrow) Taking the spread into account, a nice 10 pip profit.
How very nice of Forex to provide me with two contrasting examples in such a short period of time!
Attached Image