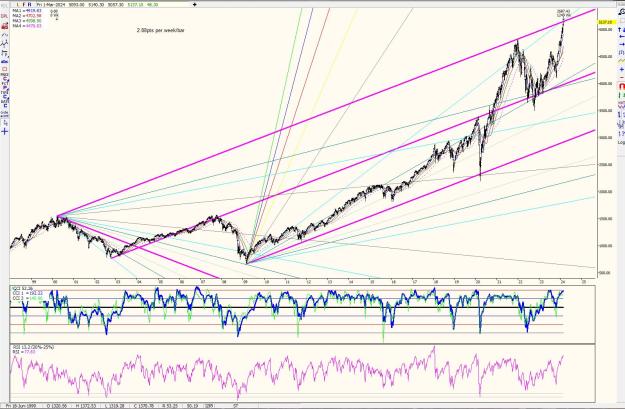
it's true...I too have a reversal date for the SP500....180 months from the 2009 minimum and Pluto's planetary line passes in the 5500 area. In the 5200 area however there are multiple Fibonacci not highlighted on the chart to avoid putting too many lines
as I had already written, I recently picked up the topic of "astronomy" again...let's see.....
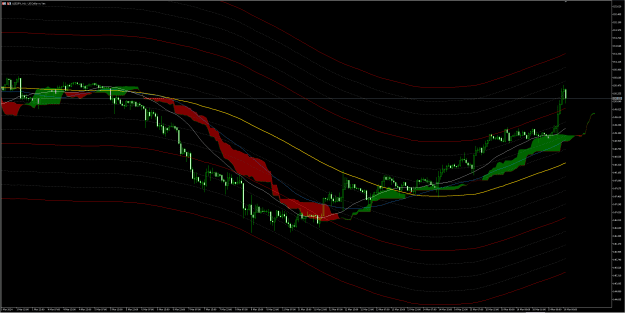
black line = PLUTO and harmonics of 90°, red line = Mars....crossroads March 11th
SP500 daily chart
as I had already written, I recently picked up the topic of "astronomy" again...let's see.....
black line = PLUTO and harmonics of 90°, red line = Mars....crossroads March 11th
SP500 daily chart
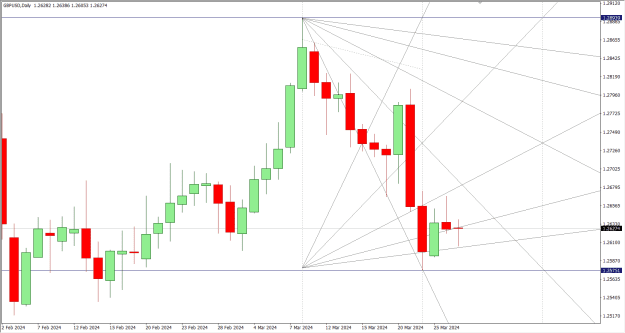
Attached Image (click to enlarge)
2