@makingmoves can you share more of your trades from time to time using this strategy please?
- #123
- Edited 2:28pm Feb 24, 2024 5:15am | Edited 2:28pm
- Joined Jun 2007 | Status: Trader | 1,010 Posts
- #136
- May 5, 2024 5:13am May 5, 2024 5:13am
- Joined Sep 2015 | Status: Trader | 2,516 Posts
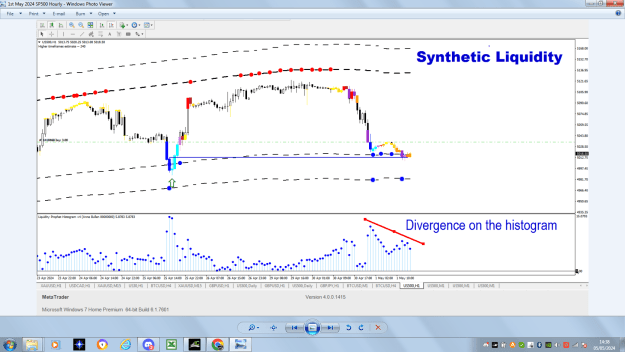
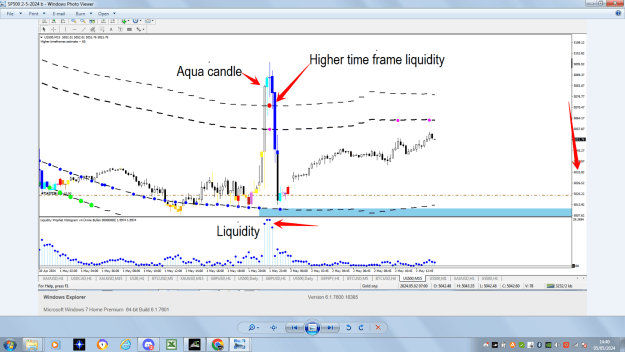
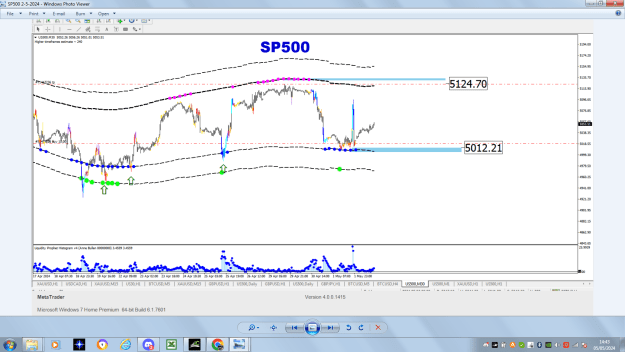
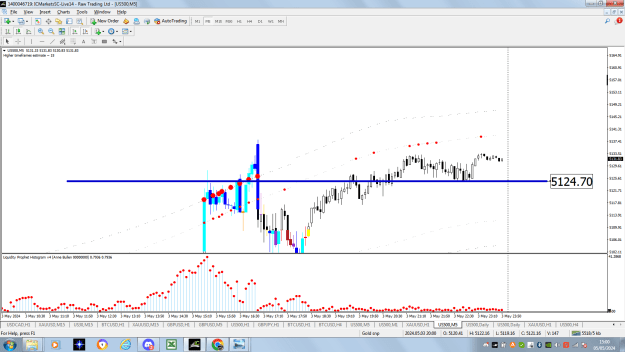
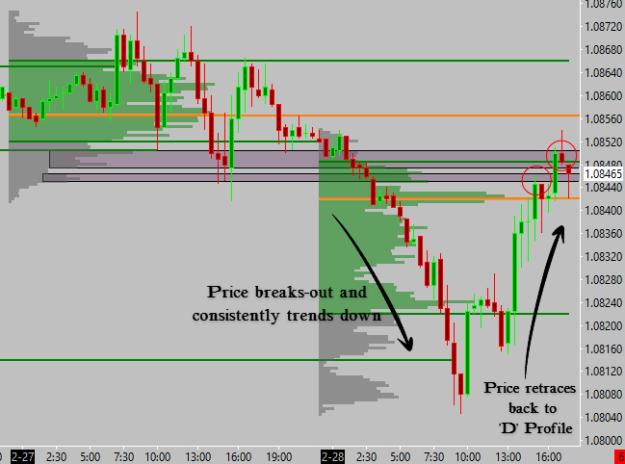
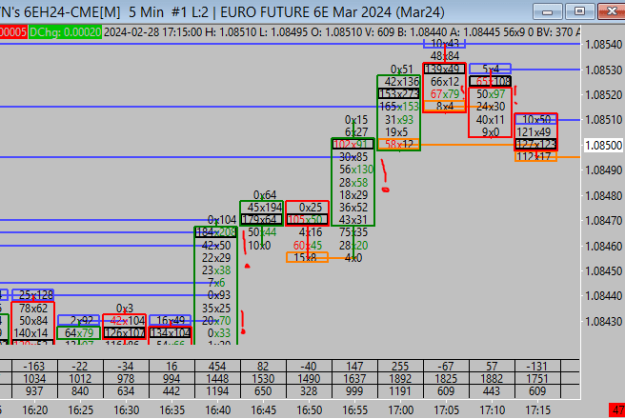
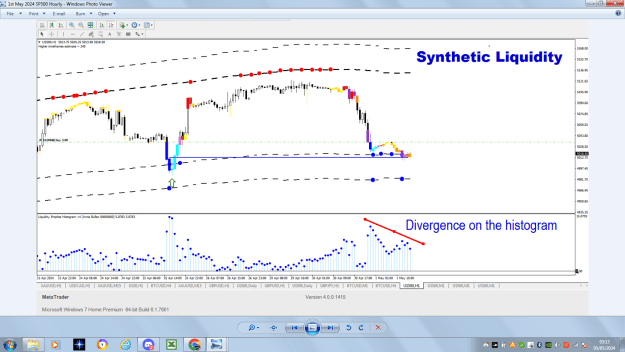
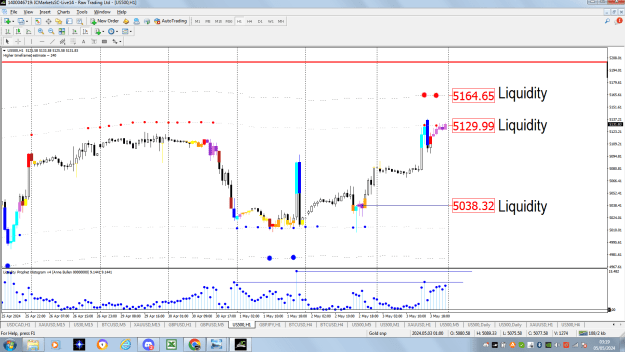
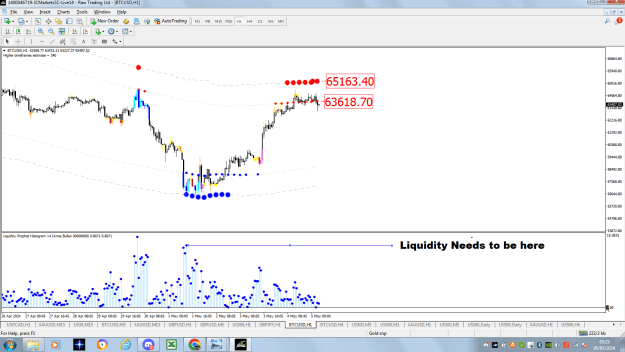
Trading thin liquidity at the boundary of the charts
- #137
- May 5, 2024 5:19am May 5, 2024 5:19am
- Joined Dec 2022 | Status: Trader | 2,427 Posts
You have an IQ lower than 90 if you interact with this user.