Hello guys, I am still searching and trying for not to call me lazy, but how can we hide box lines when I only need the horizontal lines at high and low of range
Hello guys, I am still searching and trying for not to call me lazy, but how can we hide box lines when I only need the horizontal lines at high and low of range
Ignored
The range of what? Daily, last 4 candles, last 8 candles?
I'm sure if you can define the question, we can find an answer!
Cheers.
It takes a lot for me to IGNORE you, but you can try.
{quote} The range of what? Daily, last 4 candles, last 8 candles? I'm sure if you can define the question, we can find an answer! Cheers.
Ignored
Hi Erebus
I use the boxes/lines indicator to draw true days i.e. zero NY to zero NY for recent days and weeks, and since we can't hide the boxes I have to make them same color as chart background, but problem is that lines are in front of wicks and hiding them, and sometimes we need to look at these wicks.
Thanks for your reply
{quote} Hi Erebus I use the boxes/lines indicator to draw true days i.e. zero NY to zero NY for recent days and weeks, and since we can't hide the boxes I have to make them same color as chart background, but problem is that lines are in front of wicks and hiding them, and sometimes we need to look at these wicks. Thanks for your reply
Ignored
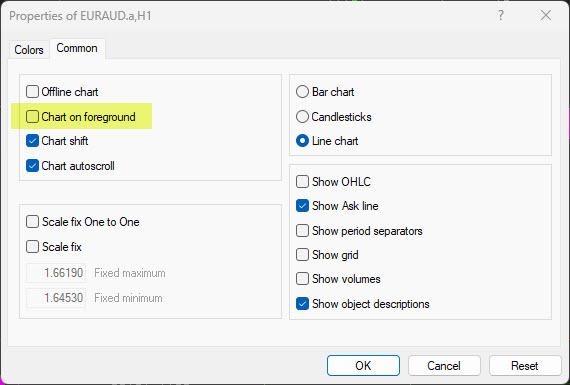
Is this setting Tick or No Tick?
Change it and see if it's helps.
Attached Image (click to enlarge)
It takes a lot for me to IGNORE you, but you can try.
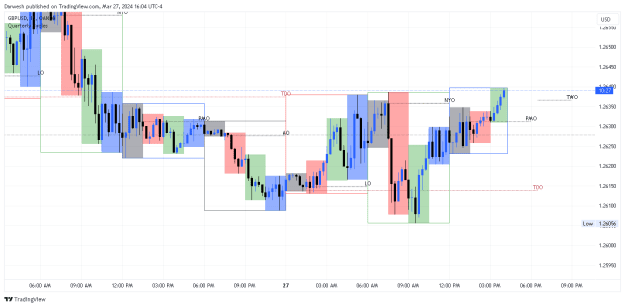
This script on tradingview is based on Day,'s quarterly theory.
This theory based on the accumulation, manipulation, disruption that happen during, monthly, weekly, daily and session.
It divided every day into 4 quarters. First is accumulation, second is manipulation, 3rd is disturbtion, 4 is x, the x or Q 4 mut reversal or contuntion dirction.
Time is important because the kill zone happens in specific opening sessions or red folder news.
anyone can create a custom mt4 indicator like this,
{quote} Hi Erebus I use the boxes/lines indicator to draw true days i.e. zero NY to zero NY for recent days and weeks, and since we can't hide the boxes I have to make them same color as chart background, but problem is that lines are in front of wicks and hiding them, and sometimes we need to look at these wicks. Thanks for your reply
Ignored
Sorry for late reply, only just saw this.
To remove filled box, in inputs eg. FPZ2 etc. remove the F this is the code for a "Filled Box".
{quote} If there is data and you have candles on the chart, it should be working Let's see your settings For example, I have one for every day of the week {image}
Ignored
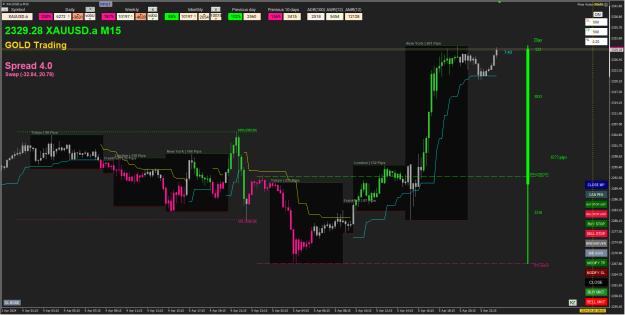
Hi erebus, greetings mate. Nice sharing all this time. If I may ask... What indicator is that that shows a single candle print on your chart on the far right of your chart? Say if it's a Daily candle whatever happening on 15m will show that candle being printed and movement as the day goes by. Do you have that indicator to share and if you do..., is there a version for both Mt4 and MT5. Much thanks. Await your revert on this. I would love to have this in both MT4 and MT5 if you have it. Thanks again for hearing me out. Cheerio
{quote} Hi erebus, greetings mate. Nice sharing all this time. If I may ask... What indicator is that that shows a single candle print on your chart on the far right of your chart? Say if it's a Daily candle whatever happening on 15m will show that candle being printed and movement as the day goes by. Do you have that indicator to share and if you do..., is there a version for both Mt4 and MT5. Much thanks. Await your revert on this. I would love to have this in both MT4 and MT5 if you have it. Thanks again for hearing me out. Cheerio
Ignored
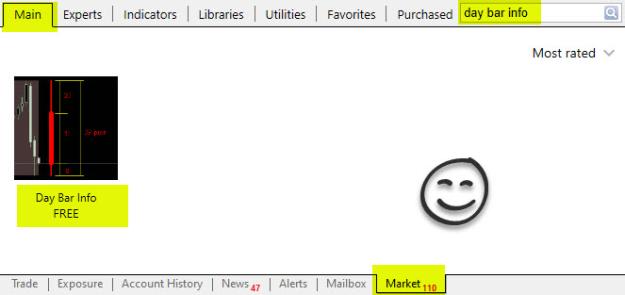
Lucky, I shared the Indicator list in the screenshot as I forgot the name of that since I stopped using it, may have to look at it again; it is Day Bar Info
The easy way to get it is installed directly within Metatrader 4, go to Market tab and Search, you should find this:
Attached Image (click to enlarge)
Failing that, do it the way our ancestors did it, download, copy & paste, restart, hope it's there...
{quote} i also use a lot ATRs and ADRs,i wonder how you guys are using this tool ? Price goes where it wants to. please share your insight,thanks
Ignored
Exactly, price does what it wants to do, ADR is a reference point of possible high and low, still have to judge the mood of the market, the time of day, so many variables, good luck.
It takes a lot for me to IGNORE you, but you can try.
With this indicator & Hanovers also, even though you have Open & Close Line settings, it always caculates onthe start candle OC
What I would prefer is range of the closed bodies ie. the highest & lowest value of opens & close of candles in that time range.
Not the Open of the first candle and close of the second candle but the closed bodies of the 2 candles or any number of candles in time range
selected.
{quote} With this indicator & Hanovers also, even though you have Open & Close Line settings, it always caculates onthe start candle OC What I would prefer is range of the closed bodies ie. the highest & lowest value of opens & close of candles in that time range. Not the Open of the first candle and close of the second candle but the closed bodies of the 2 candles or any number of candles in time range selected. {image}
Ignored
Use option "Y" The rectangle uses the max(open,close) and min(open,close) of the bars surrounded by the rectangle.
Inserted Code
    for (int j=bar1; j>bar2; j--)  {
      if (StringFind(prop,"Y",0) >= 0)  {
        hi = MathMax(hi,MathMax(iOpen(NULL,tscale,j),iClose(NULL,tscale,j)));
        lo = MathMin(lo,MathMin(iOpen(NULL,tscale,j),iClose(NULL,tscale,j)));
      } else {
        hi = MathMax(hi,iHigh(NULL,tscale,j));
        lo = MathMin(lo,iLow(NULL,tscale,j));
      }
I don't recall if Hanover ever provided documentation about the many options for the "Properties" Input variable. (default "FTZ2").
I suggest to look for it. If you find it, post it here. Then explore any other options you might be interested in. The only other way to know is to glance through the code and try to follow what each does.
If you look in the code, search for (with the ONE literal double-quote) : StringFind(prop,"
All of his options seem to include those characters as each of the options is parsed.
Two lines I am not personally a fan of would be:
Inserted Code
    hi += ClearancePips * pnt;
    lo -= ClearancePips * pnt;
Whatever are the values of the hi and lo it will use for the PlotBox(...) function (i.e. the rectangle), he pads one extra pnt (usually 0.1p now) to both. I don't happen to like the arbitrary padding, and therefore you'll see a 0.1p gap where the rectangle is always larger. It's hard to spot when the rectangle surrounds max High & min Low, but to me it's a lot more obvious there are +/- 0.1 gaps when it surrounds, using option "Y", the max(open,close) and min(open,close).
Rather, I would prefer to ONLY change the hi and or lo when they are EQUAL, because you can't have a rectangle of zero height. Something like:
{quote} With this indicator & Hanovers also, even though you have Open & Close Line settings, it always caculates onthe start candle OC What I would prefer is range of the closed bodies ie. the highest & lowest value of opens & close of candles in that time range. Not the Open of the first candle and close of the second candle but the closed bodies of the 2 candles or any number of candles in time range selected. {image}
Ignored
Highest top and lowest bottom within time range?
There is something like that...
My Threads: Trading is as simple as 1-2-3, Highest Open / Lowest Open Trade
Can someone help me here. I need an indicator which will show opening candle, opened and closed body, in a box which will be extended until the week is completed thank you. Please example attached on the picture.