• Home
  • Forums
  • Trades
  • News
  • Calendar
  • Market
  • Brokers
  • Login
  • Join
  • User/Email: Password:
  • 2:32am
Menu
  • Forums
  • Trades
  • News
  • Calendar
  • Market
  • Brokers
  • Login
  • Join
  • 2:32am
Sister Sites
  • Metals Mine
  • Energy EXCH
  • Crypto Craft

Options

Bookmark Thread

First Page First Unread Last Page Last Post

Print Thread

Similar Threads

Automatic session boxes indicator 69 replies

Horizontal lines with color change and price boxes 2 replies

Indicator with tick boxes on main chart window 2 replies

Russian Doll - Boxes within boxes price action 6 replies

Anyone have a H/L sessions indi that uses lines instead of boxes? 2 replies

  • Platform Tech
  • /
  • Reply to Thread
  • Subscribe
  • 217
Attachments: Daily Boxes/Lines indicator
Exit Attachments
Tags: Daily Boxes/Lines indicator
Cancel

Daily Boxes/Lines indicator

  • Last Post
  •  
  • Page 1 23456 28
  • Page 1 234 28
  •  
  • Post #1
  • Quote
  • First Post: Edited Apr 15, 2020 9:03pm Sep 20, 2010 11:28am | Edited Apr 15, 2020 9:03pm
  •  hanover
  • Joined Sep 2006 | Status: ... | 8,092 Posts
NOTE: I have left Forex Factory, so don't expect replies to your posts. You can find an index to all my indicators and posts here.

Daily Lines/Boxes indicator: Terms and Conditions

 All code is supplied FREE of charge. It may NOT be sold or distributed commercially. Unless otherwise shown, no source code is available.

 Software is offered on an 'as is' basis. I'm not offering a programming or troubleshooting service.

 There is no guarantee that the software is fit for purpose, or free of errors. Download and use the indicator(s) at your own risk; I accept no liability for computer damage or financial losses.
___________________________

Instructions

The attached indicator will draw filled or unfilled boxes, and/or vertical or horizontal lines, the same time period for each day of the week that you specify. It can be used to plot breakout boxes, session delimiters, S/R lines, etc. It can now also plot Wingding symbols above/below candles also.

Download it into your ...../MQL4/Indicators folder.
Note: If you download the .mq4 source, then you must do this first, if you want the indicator to compile/run correctly.

Parameters

LookbackDays - number of days to plot the boxes/lines for, counting back from the current date. Each day is assumed to start and end at midnight (MT4 time). If you want to plot boxes/lines back to the beginning of the chart, set its value to a large number like 999999; it will not attempt to plot objects beyond the first candle in the chart.

StartHours
EndHours
ExtendHours - this is the hour of the day (MT4 time). A value of 0 is midnight. A positive number refers to X hours after midnight, e.g. 5 = 0500 hours. Use negative numbers to plot back into the previous day, e.g. -5 = 1900 hours. You may also include decimal values, e.g. 4.5 = 0430 hours, -6.25 = 1745 hours; and you can also extend lines/boxes into future or prior days by using values greater than 24 or less than -24, e.g. 40 = 1600 hours into the following day.

  1. Boxes are plotted from StartHours to ExtendHours, unless the 'T' property is included in Properties, in which case they are truncated at EndHours. The upper and lower extremities of each box are determined by the highest and lowest prices between StartHours and EndHours. (Note/hint: you can make EndHours and ExtendHours the same value).
  2. Twin Horizontal lines are plotted from StartHours to ExtendHours, using the highest and lowest prices between StartHours and EndHours.
  3. Vertical lines are plotted at StartHours, and (if the 'VV' property is included) at ExtendHours also.

UniqueID - you can plot multiple regions or sessions by attaching multiple instances of the indy to the same chart, but you must give each instance a different UniqueID.

BoxColor
LineColor - the colors that will be used to plot the boxes, and lines, respectively.

Properties - include any combo of the following characters (upper or lowercase), in any order:
Z = plot twin horizontal lines (from the highest high and lowest low between StartHours and EndHours)
Y = same as Z except the lines are plotted between the candle highest body (open/close) and lowest candle body (open/close) between StartHours and EndHours
C = plot a single horizontal line from the close of the candle at StartHours
O = plot a single horizontal line from the open of the candle at StartHours
H = plot a single horizontal line from the high of the candle at StartHours
L = plot a single horizontal line from the low of the candle at StartHours
A = plot a single horizontal line from the midpoint (average of the high and low) of the candle at StartHours
X = extend horizontal lines (as rays) to the RHE of the chart (useful for plotting daily/session highs/lows as S/R)
V = plot a single vertical line (V^ plots a single vertical line without its extending into sub-windows below the main chart)
VV = plot twin vertical lines (VV^ plots twin vertical lines without their extending into sub-windows below the main chart)
B = plot a box (default is unfilled)
F = plot a filled box
T = truncate box at EndHours
P = display box height (in pips). Must have object descriptions switched on (press F8, on Common tab). Alternatively, you can use TextProperties to display box heights (explained below).
> (greater than symbol) = plot the box between the open price at the StartTime, to the highest price in the time interval enclosed by the box
< (less than symbol) = plot the box between the open price at the StartTime, to the lowest price in the time interval enclosed by the box
Integer between 1 and 5 = line/box width
Line/box style is assumed to be solid, unless any one of the following tokens is included:
-- = dashed
. = dotted
-. = dash-dot ('N' in Morse code )
-.. = dash-dot-dot ('D' in Morse code )
E = determine the highest volume candle between StartHours and EndHours. Then plot a horizontal line, between StartHours and ExtendHours, from the high and low of this candle
R = determine the highest range candle between StartHours and EndHours. Then plot a horizontal line, between StartHours and ExtendHours, from the high and low of this candle
M = find the candle, between StartHours and EndHours, whose volume multiplied by its range has the greatest value. Then plot a horizontal line, between StartHours and ExtendHours, from the high and low of this candle
D = find the candle, between StartHours and EndHours, whose volume divided by its range has the greatest value. Then plot a horizontal line, between StartHours and ExtendHours, from the high and low of this candle
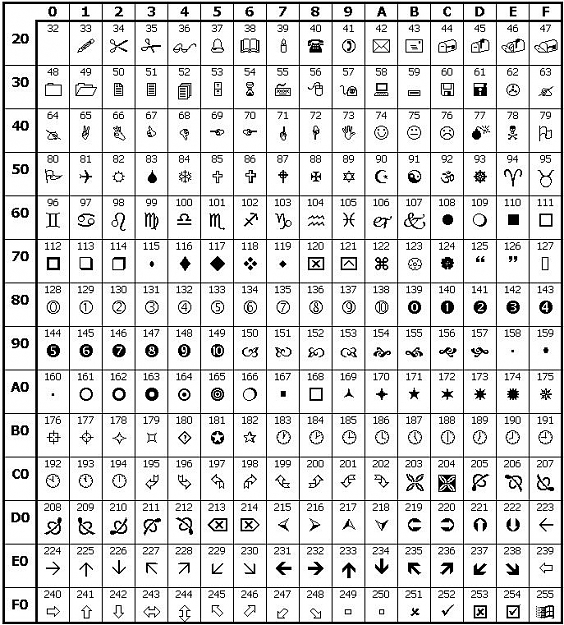
W = plot a Wingdings symbol above/below the candle at StartHours (see SymbolProperties for details)
WW = plot two Wingdings symbols; one above/below the candle at StartHours, the other above/below the candle at ExtendHours (see SymbolProperties for details)

HorizLineLevels - this applies only to the single horizontal line plotting options (Properties = C, O, H, L or A). Multiple horizontal lines will be drawn X pips above/below the Close, Open, High, Low or Average point of the candle specified by StartHours. Up to 99 levels may be specified, separated by commas. For example (and if Properties = C), an entry of -10,0,20 would plot lines at 10 pips below the close price, the close price itself, and 20 pips above the close price. An entry of 0 would simply plot a single horizontal line from the close price

TextProperties - blank out this field unless you want informational text displayed above/below the box. If the latter (which is an alternative to setting Properties = P), the format for this parameter is <fontname>,<fontsize>,<fontcolor>,<vertspacing>,<data type>,<format 1>,<format 2>,<horiz shift> in that order, separated by commas:
<fontname> = must be the name of a valid installed Windows font, and is case sensitive
<fontsize> = an integer that determines the size of the text
<fontcolor> = must be either a valid MT4 color token (e.g. Green, SaddleBrown, Goldenrod, CornflowerBlue, etc), or a custom entry like RnnnGnnnBnnn, e.g. G255R255 (green=255, red=255, no blue) is the same as Yellow.
<vertspacing> = the number of pips above the box high, or below the box low, where the text will be displayed. Positive value = above the high; negative value = below the low.
<data type> valid entries are P=height of box in pips; H=price at Highest point of box; L=price at Lowest point of box; S=price at open of Start candle; E=price at close of End candle; X=price at close of Extend candle. You may use upper or lowercase, multiple entries (e.g. HL) are permitted
<format 1> = format for the date/time, if you want it output; leave blank otherwise
<format 2> = format for the value (#pips,high,low,start,end,extend price)
See here for detailed info on format masks
<horiz shift> = how many candles (positive number = rightward; negative number = leftward) to shift the text, to get the desired horizontal location

SymbolProperties - this is relevant only if you've entered W or WW in the Properties setting. The format for this parameter is <symbolsize>,<symbolcolor>,<symbolnumber>,<vertspacing> in that order, separated by commas:
<symbolsize> = an integer (1 thru 5) that determines the size of the plotted symbols
<symbolcolor> = determines the colors of the plotted symbols. Must be either a valid MT4 color token (e.g. Green, SaddleBrown, Goldenrod, CornflowerBlue, etc), or a custom entry like RnnnGnnnBnnn, e.g. G255R255 (green=255, red=255, no blue) is the same as Yellow.
<symbolnumber> = the Wingdings symbol number. See the table attached to this post.
<vertspacing> = the number of pips above the candle high, or below the candle low, where the symbol will be displayed. Positive value = above the high; negative value = below the low.

DaysOfWeek - which days of the week you want the boxes/lines plotted. Use the first three characters of the name, e.g. Mon, Tue, Sat. Upper or lowercase, separated by commas. (Example: If you want to plot a vertical line at weekly open, set DaysOfWeek = Mon. If you want weekly opens as blue lines, and other daily opens as red lines, attach two instances of the indicator: (1) DaysOfWeek = Mon (2) DaysOfWeek = Tue,Wed,Thu,Fri).

DaysOfMonth - which days of the month you want the boxes/lines plotted. Simply modify the existing list; entries must be separated by commas.

Visibility - which timeframes you want the boxes/lines to appear on. Upper or lowercase, separated by commas. Valid entries are M1, M5, M15, M30, H1, H4, D1, W1, MN

TimeFrame - which timeframe's candles will be used to determine the highs/lows across the window between StartHours and EndHours. Valid entries are M1, M5, M15, M30, H1, H4, D1, W1 or MN (upper or lowercase). Or if you leave the field blank, it defaults to the current chart's timeframe.

CandlesMustExist - if set to true, and a candle of the required time does not exist, no line will be plotted.

ClearancePips - allows the boxes or horizontal lines to be plotted/extended X pips above the price high, and below the price low. Useful for plotting box breakouts, where the trade entry point is X pips above/below the box

RefreshPeriod - this determines how often MT4 replots the boxes/lines, allowable values are explained here.

SecondaryPipCount -
--- if TRUE, up to two additional horizontal lines are plotted between EndHours and ExtendHours, at the high and low of this period, if this high and/or the low exceed(ed) the high and/or low of the period between StartHours and EndHours, for the same day. These additional lines are plotted using the same parameters (color, width, style, ray, visibility) as the 'parent' lines. Both the 'high' line and 'low' line operate independently of each other, e.g. if the high is exceeded but not the low, then only the 'high' line will be plotted. Additionally, if TextProperties is non-blank, then the number of pips by which the high and/or low was exceeded is displayed above/below the line, and the line is plotted using the same color as the text
--- if FALSE (the default value), none of the above is performed

UniqueID - If you want to attach two or more instances of the indicator to the same chart, you must give each instance a different UniqueID value. Failure to do so will cause unpredictable results, as each instance will become confused as to which plotted objects belong to it, and which objects belong to other instances.


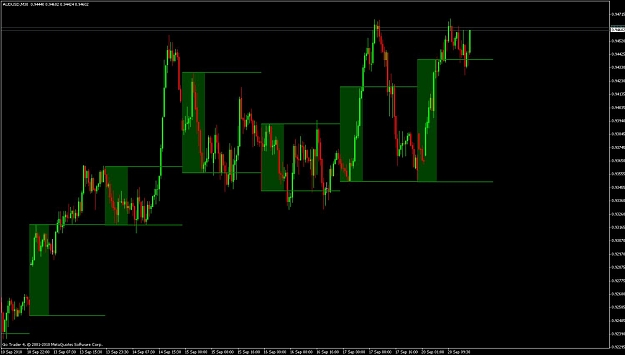
NOTE: The screenshot below is the result of setting Properties = FTZ2
Attached Image(s) (click to enlarge)
Click to Enlarge

Name: daily boxes1.jpg
Size: 84 KB
Click to Enlarge

Name: Wingdings table.JPG
Size: 162 KB
Attached File(s)
File Type: ex4 Daily LinesBoxes(1).ex4   43 KB | 7,505 downloads | Uploaded Apr 15, 2020 2:57pm
  • Post #2
  • Quote
  • Sep 26, 2010 4:15am Sep 26, 2010 4:15am
  •  forexsaint
  • Joined Jun 2009 | Status: &lt;-That's how u gonna b, in the END! | 1,509 Posts
Though i dont have major application of time boxes in any of my strategies, i really appreciate the work and share (for the times when i test things with boxes)
The indi is as beautiful and quite customizable as other stuff shared by hanover!

Thanks . Keep doing the good work mate
100 Fold Challenge->Interested? ->https://www.forexfactory.com/thread/32152
 
1
  • Post #3
  • Quote
  • Sep 26, 2010 4:52am Sep 26, 2010 4:52am
  •  Alihuzaifa
  • | Membership Revoked | Joined Oct 2008 | 2,791 Posts
thanx for the time spent on this indi,might be useful for folks.
 
 
  • Post #4
  • Quote
  • Sep 26, 2010 5:03am Sep 26, 2010 5:03am
  •  mindreality
  • | Joined Mar 2010 | Status: Member | 338 Posts
Hi,

I am trying to use this indicator as a period separator as state from my other thread:
http://www.forexfactory.com/showthre...53#post4049053

But the lookback is limited up to a certain amount.

How can I specify infinite lookback period so that it extends all the way to the start of the chart no matter how long it is?

Or can I have one that does not have a limited lookback period?
 
 
  • Post #5
  • Quote
  • Edited 11:43am Sep 26, 2010 11:30am | Edited 11:43am
  •  hanover
  • Joined Sep 2006 | Status: ... | 8,092 Posts
Quoting mindreality
Disliked
How can I specify infinite lookback period so that it extends all the way to the start of the chart no matter how long it is?
Ignored
Download the latest version from post #1, and set LookbackDays = 999999

I've added a line of code that stops the indy from trying to plot objects beyond the first candle in the chart.
 
3
  • Post #6
  • Quote
  • Sep 26, 2010 5:40pm Sep 26, 2010 5:40pm
  •  mindreality
  • | Joined Mar 2010 | Status: Member | 338 Posts
Hi,

The indicator doesn't always draw the start and end times properly.

If my broker closes at 21:00 on the weekend and I set the start and end time as 23:00, it will draw the line at 21:00 and mark it as 23:00 instead during the weekend.
 
 
  • Post #7
  • Quote
  • Sep 27, 2010 12:19am Sep 27, 2010 12:19am
  •  mindreality
  • | Joined Mar 2010 | Status: Member | 338 Posts
Can you make the lines translucent and dotted and dotted as well?

When I use it on an offline chart, the lines are opaque and I can't see the bottom and top wick of the candle.
 
 
  • Post #8
  • Quote
  • Sep 27, 2010 2:02am Sep 27, 2010 2:02am
  •  hanover
  • Joined Sep 2006 | Status: ... | 8,092 Posts
Quoting mindreality
Disliked
Hi,

The indicator doesn't always draw the start and end times properly.

If my broker closes at 21:00 on the weekend and I set the start and end time as 23:00, it will draw the line at 21:00 and mark it as 23:00 instead during the weekend.
Ignored
That's because MT4 plots vertical lines on the nearest candle, if a candle with the exact time doesn't exist. Try this with a manually added line and you'll see what I mean.

When I get some time, I'll add a DaysOfWeek parameter so that you can select the days on which you want the lines plotted. Then you can stop Friday 23:00 lines from being plotted if you wish; and/or attach a second instance of the indy if you want the Friday lines to plot at a different time.

Translucent lines - I can't find a function in MT4 that does this.

Dotted lines - you can add dots (.) and dashes (-) to the Properties to change the line style - see post #1 for instructions.

You can also select MT4 menu option Charts..... Foreground Charts to have the lines plot 'behind' the candle wicks.
 
 
  • Post #9
  • Quote
  • Sep 27, 2010 2:16am Sep 27, 2010 2:16am
  •  hanover
  • Joined Sep 2006 | Status: ... | 8,092 Posts
Quoting hanover
Disliked
When I get some time, I'll add a DaysOfWeek parameter so that you can select the days on which you want the lines plotted. Then you can stop Friday 23:00 lines from being plotted if you wish; and/or attach a second instance of the indy if you want the Friday lines to plot at a different time.
Ignored
I've done this and uploaded a new version to post #1. If you attach multiple instances of the indy to the same chart, be sure to give each a different UniqueID. Otherwise MT4 won't know which objects to remove if you delete the indy.

OK, I'd best get on with something that's selfishly productive now. The source code is there if anybody else wants to modify it further.

[EDIT] You might like to try this indy also.
 
 
  • Post #10
  • Quote
  • Sep 27, 2010 2:47am Sep 27, 2010 2:47am
  •  mindreality
  • | Joined Mar 2010 | Status: Member | 338 Posts
Hi,

What I mean is that the indicator draws the line on 21:00 on Friday even though there IS a 23:00 candle after that when it opens again.

Can you make the indicator draw the line on the candle exact timing if it exist, instead of drawing it on the weekly close?
 
 
  • Post #11
  • Quote
  • Sep 27, 2010 3:19am Sep 27, 2010 3:19am
  •  hanover
  • Joined Sep 2006 | Status: ... | 8,092 Posts
Quoting mindreality
Disliked
Hi,

What I mean is that the indicator draws the line on 21:00 on Friday even though there IS a 23:00 candle after that when it opens again.

Can you make the indicator draw the line on the candle exact timing if it exist, instead of drawing it on the weekly close?
Ignored
Can't reproduce that situation as my br0ker operates different hours.
 
 
  • Post #12
  • Quote
  • Sep 27, 2010 3:31am Sep 27, 2010 3:31am
  •  mindreality
  • | Joined Mar 2010 | Status: Member | 338 Posts
Is it possible to make the indicator ignore weekly closes and just draw the line ONLY on the exact time candle every day?
 
 
  • Post #13
  • Quote
  • Sep 27, 2010 11:05am Sep 27, 2010 11:05am
  •  hanover
  • Joined Sep 2006 | Status: ... | 8,092 Posts
Quoting mindreality
Disliked
Is it possible to make the indicator ignore weekly closes and just draw the line ONLY on the exact time candle every day?
Ignored
If the lines being plotted on Fridays are causing you a problem, due to your br0ker's shutdown time, then set
DaysofWeek = Mon,Tue,Wed,Thu
so that the Friday lines don't plot.

Or if it's the lines being plotted at the start of the week that you want removed, set
DaysofWeek = Tue,Wed,Thu,Fri

Beyond that, I don't understand what you mean by "ignore weekly closes".

Like I said before, MT4 will always plot a line on the nearest candle to the date/time that you specify. There is no way of avoiding that.
 
 
  • Post #14
  • Quote
  • Sep 27, 2010 1:48pm Sep 27, 2010 1:48pm
  •  mindreality
  • | Joined Mar 2010 | Status: Member | 338 Posts
What is happening is that the indicator draws the line on my broker closing time on Friday "21:00" instead of 23:00 like the other days.

There is a 23:00 candle when it opens again on Sunday night, but the line is not drawn there.

I think I understand what might solve it.

Is it possible to set only start or end time?

Can I enable Sunday to be plotted?

I couldn't find DaysofWeek as one of the inputs of the indicator, how or where in the code can I edit this?
 
 
  • Post #15
  • Quote
  • Sep 27, 2010 4:25pm Sep 27, 2010 4:25pm
  •  hanover
  • Joined Sep 2006 | Status: ... | 8,092 Posts
Quoting mindreality
Disliked
I couldn't find DaysofWeek as one of the inputs of the indicator, how or where in the code can I edit this?
Ignored
Download the latest version from post #1.

Try setting DaysOfWeeek = Mon,Tue,Wed,Thu,Sun

or DaysOfWeeek = Mon,Tue,Wed,Thu
if you don't want the Sunday 23:00 line.

Set StartTime = 23
to have line plotted at 23:00 (MT4 time) on each of the weekdays you specify.

or set StartTime = -1
to have the line plotted at 23:00 on the previous day.

You can also try changing CandleMustExist to true

If Properties = V.
(one 'V' only), then only the StartTime is relevant. EndTime and ExtendTime will not be used.

Please read the instructions in post #1 for more info.

One of these combos should deliver the result you're looking for. If not, I don't know what else to try.
 
 
  • Post #16
  • Quote
  • Sep 28, 2010 1:00pm Sep 28, 2010 1:00pm
  •  GeraldFX
  • | Joined Sep 2009 | Status: Cloud Surfer | 540 Posts
Hi Hanover,

Could you also add to draw a horizontal like at the open price of the start time and display the pips for top area (open price to highest) and bottom area (open price to lowest)?

You can refer to here: http://www.forexfactory.com/showthread.php?t=258055
 
 
  • Post #17
  • Quote
  • Sep 28, 2010 4:24pm Sep 28, 2010 4:24pm
  •  hanover
  • Joined Sep 2006 | Status: ... | 8,092 Posts
Quoting gerald20000
Disliked
Hi Hanover,

Could you also add to draw a horizontal like at the open price of the start time and display the pips for top area (open price to highest) and bottom area (open price to lowest)?

You can refer to here: http://www.forexfactory.com/showthread.php?t=258055
Ignored
OK, download the latest version from post #1, for the quick'n'dirty solution.

Attach one instance of the indy, to plot the top box, as follows:
Properties = FTP>
UniqueID = #1

Attach a second instance of the indy, to draw the bottom box:
Properties = FTP<
UniqueID = #2

The 'T' property means that the boxes will be plotted between the StartTime and EndTime.

The 'P' property will display box heights - if you follow the instructions in post #1. If the bottom box's displayed height is obscured by a candle body, simply toggle between a line chart and a candle chart.

Set the BoxColor settings to whatever colors you require.
 
 
  • Post #18
  • Quote
  • Sep 29, 2010 12:54am Sep 29, 2010 12:54am
  •  GeraldFX
  • | Joined Sep 2009 | Status: Cloud Surfer | 540 Posts
Perfect! Thank you so much!
 
 
  • Post #19
  • Quote
  • Edited 5:19am Sep 29, 2010 3:38am | Edited 5:19am
  •  hanover
  • Joined Sep 2006 | Status: ... | 8,092 Posts
Quoting gerald20000
Disliked
Perfect! Thank you so much!
Ignored
You're welcome. It's feedback like yours that encourages me to keep contributing to forums like this one.

When I get some time, I'll create an option where the box height displays below the lower box, so that it's not obscured by the candles.

[EDIT] All done! Download the latest version of the indicator from post #1. See post #1 for data on how the new TextProperties parameter operates.
 
 
  • Post #20
  • Quote
  • Sep 29, 2010 8:18pm Sep 29, 2010 8:18pm
  •  slimcat
  • | Joined Jul 2007 | Status: Demo Trader | 175 Posts
Thank you for this indicator Hanover, I have beeen looking for something like this for ages.

May I add you are singularly the most well respected member of this great sharing forum.

Thanks Jay
 
 
  • Platform Tech
  • /
  • Daily Boxes/Lines indicator
  • Reply to Thread
    • Page 1 23456 28
    • Page 1 234 28
0 traders viewing now
  • More
Top of Page
  • Facebook
  • Twitter
About FF
  • Mission
  • Products
  • User Guide
  • Media Kit
  • Blog
  • Contact
FF Products
  • Forums
  • Trades
  • Calendar
  • News
  • Market
  • Brokers
  • Trade Explorer
FF Website
  • Homepage
  • Search
  • Members
  • Report a Bug
Follow FF
  • Facebook
  • Twitter

FF Sister Sites:

  • Metals Mine
  • Energy EXCH
  • Crypto Craft

Forex Factory® is a brand of Fair Economy, Inc.

Terms of Service / ©2023