Disliked{quote} January 24, 2024 EURUSD I am trying to catch the quick movement of small cycles based on FIBO volatility levels. Today’s Asian Session position Buy Stop 0.236 TP1 0.382 (BE) TP2 0.5 SL Sell Side 0.236 Sell Stop 0.236 TP1 0.382 (BE) TP2 0.5 SL Buy Side 0.236 PLEASE NOTE THAT I HAVE NO COMMERCIAL INTENTIONS. https://youtu.be/4H-wCLVEYn8Ignored
In other threads, i realized that many traders did not understand those pending orders so here is explanation.
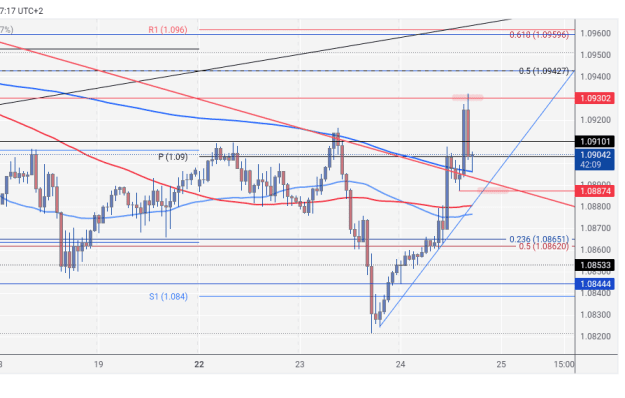
Here is full detail with chart and pending orders. This is example of my today's orders.
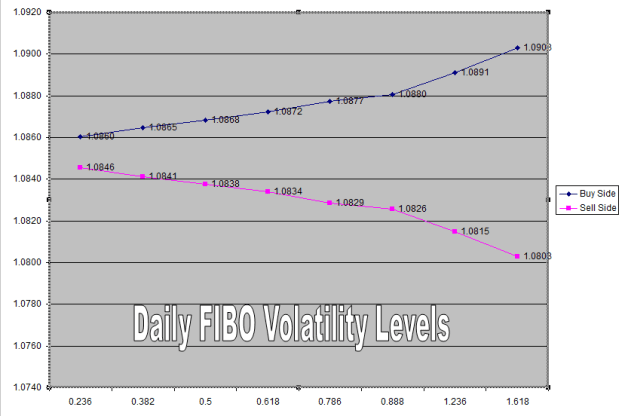
On the chart, there are two lines. Blue and Pink.
Price levels on blue line are for Buy Stop order.
Price levels on pink line are for Sell Stop order.
Blue line (Buy Stop order) start with 1.0860 at the level of 0.236
Pink line (Sell Stop Order) start with 1.0846 at the level of 0.236
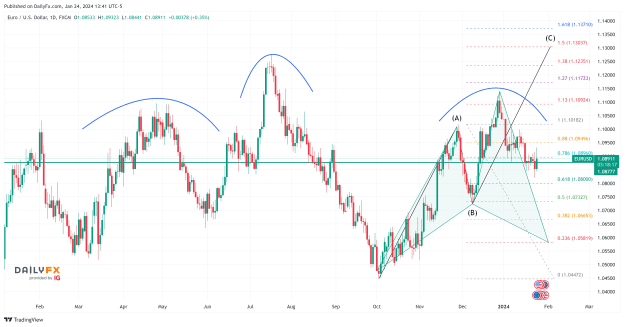
Daily open price was 1.0853 on my chart. (open price was different with small gap so i waited that price come to yesterday's closing price and then set pending orders.
Area between 1.0860 and 1.0846 is no trade zone.
I had two pending orders.
Buy Stop 0.236 TP1 0.382 (BE) TP2 0.5 SL Sell Side 0.236
Sell Stop 0.236 TP1 0.382 (BE) TP2 0.5 SL Buy Side 0.236
My Buy Stop order activated at 0.236 (1.0860) and hit TP1 and TP2. TP1 was at 0.382 level with price 1.0865. TP2 was at 0.5 level with price 1.0868
This is totally your choice that you wanted to close full position at TP1 or half position and wait for price to hit TP2.
Please let me know if this detail is enough to understand ? and feel free to ask me more questions.
Attached Image (click to enlarge)
Love for all; Hatred for none.
1