• Home
  • Forums
  • Trades
  • News
  • Calendar
  • Market
  • Brokers
  • Login
  • Join
  • User/Email: Password:
  • 11:01am
Menu
  • Forums
  • Trades
  • News
  • Calendar
  • Market
  • Brokers
  • Login
  • Join
  • 11:01am
Sister Sites
  • Metals Mine
  • Energy EXCH
  • Crypto Craft

Options

Bookmark Thread

First Page First Unread Last Page Last Post

Print Thread

Similar Threads

4 Hour Strategy Macd+other Indicator 21 replies

average true range for 1 hour and 4 hour charts 2 replies

X-1102 1 hour , 4 hour and daily Tf trades 7 replies

Create a verticle line at certain hour for every certain hour 16 replies

Is the "4 Hour Strategy (MACD)" the best system here at FF? 20 replies

  • Commercial Content
  • /
  • Reply to Thread
  • Subscribe
  • 12,924
Attachments: 4 Hour Strategy (MACD)
Exit Attachments
Tags: 4 Hour Strategy (MACD)
Cancel

4 Hour Strategy (MACD)

  • Last Post
  •  
  • 1 257258Page 259260261 1578
  • 1 Page 259 1578
  •  
  • Post #5,161
  • Quote
  • Edited 10:10pm Jun 16, 2007 4:54pm | Edited 10:10pm
  •  shreem
  • | Joined Apr 2006 | Status: Pips for everybody | 274 Posts
Hello Ammar2000a70, yes that is it. When you find a good setup, either a TC, RB, RT or any others with a clear discernible price motion of the market (either trending or ranging), your R:R need to be calculated in relation of the motion of the market.

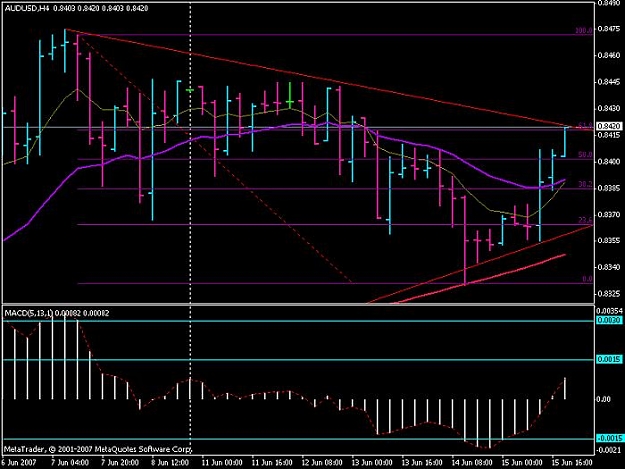
Exemple, in an uptrend, when the price is above the 89SMA and is trending and reverse to the 21EMA and there is a Trend Continuation Pattern (TC) on the MACD, you can see that you have a good setup to go long. Then, for your R:R, you can use a point under the 21EMA or under the last candle low for your stop loss and a resistance line (either trend line, figure (round number), pivot line or fibonacci level for your take profit. The important point is that the R:R need to be equal or even great than 1:1 so that at a minimum your take profit is equal to your risk.

For a downtrend, you look at things the opposite way.

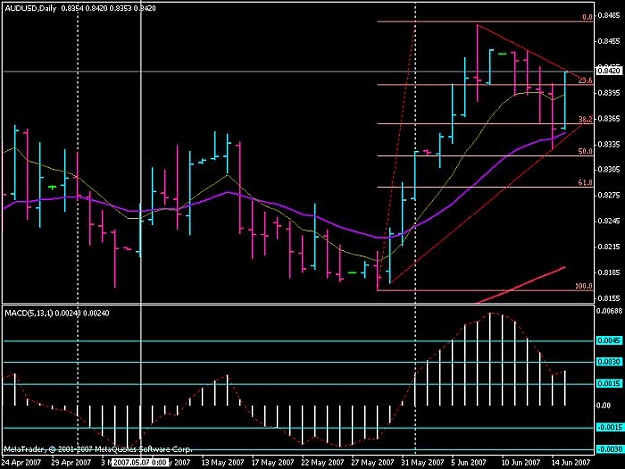
When you determine that the maket is in an established ranging mode, your draw the main resistance and support trendline from the weekly (even monthly) unto the 4H and you look for high probability trades with Round Bottom (RB) or Round Top (RT) on MACD that are in accordance with the Resistance or support trendline. In these cases, your stop loss can be above the resistance tendline or support trendline (depending the case), a round number if it the case, the 200SMA or 365 EMA if the case, as your stop loss and any of the EMA or SMA in the way for your profit target.

The crucial point, as Phillip as shown us, is to be patient, disciplined and always wait for a high probability trade only after you have made a thorouly analysis of the price motion of the market (where is the current price action in relation to the 89SMA, where it is in relation to the 200SMA, the 365EMA, the 10EMA and very importantly to the 21EMA)? Is the price in an established uptrend (price above the 89SMA with definite bounce from the 21 EMA)? Is it in an established downtrend (price below the 89SMA and definite bounce from the 21EMA)? Is the MACD signal in harmony with the current price motion of the market?

Then, if it is, you need to look to be sure that your R:R is equal or more than 1:1.

I do really think that to be successful in this 4H MACD system or the 5min method is really to (as Phillip have said again and again) is to look at all the PDF files and attachment, listen to all the MP3, read all the posts of both threads and backest by demo trading how the setup look like according to all the above principles.

Phillip is certainely right in saying that this is not a get quick rich system but a mid-term to long-term process of learning, assimilating and implementing the different aspect of this great and extraordinary system.

Sorry for the long e-mail, I think i have too much inspiration.

Hope this will help you Ammar2000a70

All great week-end to all.

Shreem
 
 
  • Post #5,162
  • Quote
  • Jun 16, 2007 6:08pm Jun 16, 2007 6:08pm
  •  lever70
  • Joined Jun 2006 | Status: sycophant | 285 Posts
Quoting Phillip Nel
Disliked
Info
Ignored
Thank you for this, Phillip. Indeed, I share the same goal: to help people profit without the need to resort to vendors and signal sellers, most of whom have nothing of value to offer. And of course, there is nothing wrong with combining methods. Alexander Elder has noted that everyone who trades his Triple Screen system successfully has altered it in one way or another to suit their trading personality, and that this is the mark of a winner.

Have a good week trading, Phillip and everyone here.

Felicia
 
 
  • Post #5,163
  • Quote
  • Jun 16, 2007 6:28pm Jun 16, 2007 6:28pm
  •  asu4
  • | Joined Nov 2006 | Status: Member | 6 Posts
Hey guys!
Take a look at this graph (4hrs)...
What do u think?

And the graph daily, maybe a PIN ???


Sorry by my poor english!

See ya!
Attached Image(s) (click to enlarge)
Click to Enlarge

Name: 1.jpg
Size: 60 KB
Click to Enlarge

Name: 2.jpg
Size: 62 KB
 
 
  • Post #5,164
  • Quote
  • Jun 16, 2007 7:08pm Jun 16, 2007 7:08pm
  •  hndymann
  • | Joined May 2007 | Status: Member | 302 Posts
Quoting SedonaPipper
Disliked
hndymann,

Be aware in your backtesting, if you base it on MACD signals alone you will be curve fitting. Many times a MACD entry signal will show up and then disappear due to price action. Though it is a good exercise to get a feel for the varasity of this system, you will become frustrated in the beginning of actual trading because you will just follow Entry signals blindly because your back testing said so. I would encourage you to backtest then spend time, paper trading to get a feel for market action, time of day, day of the week, and other factors that at first glance might not seem important. I would also encourage you to spend time learning trend lines, support - resistance and candlestick formations - still the core aspects of technical trading. Feel confidence with this system, it does work and most often the failures are operator errors. Spend time analyzing the failed trades. There usually was a indication before entry that implied the trade entry was too early. Quite often it is better to be late than early.

Happy Trading

SedonaPipper
Ignored

SedonaPipper,

Thanks for your input, maybe I was a little bit vague on my ideas of backtesting. I have been using the f12 method of looking at candles frame by frame, drawing trend lines(S&R lines) on what I see, placing mock-up trades and analyzing where I went wrong. Does this sound like a good start? When the market opens up on sunday night, that is where I plan to do my paper trades, I know it's all different when the candles are forming by the second. I am actually looking forward to the frustration, thats where I learn the most.

Luke
 
 
  • Post #5,165
  • Quote
  • Edited Jun 17, 2007 9:06am Jun 16, 2007 11:47pm | Edited Jun 17, 2007 9:06am
  •  O'Zeeke
  • | Joined Feb 2007 | Status: Member | 172 Posts
Quoting Phillip Nel
Disliked
Info
Ignored
Thank you Phillip for the explianation of the EMA and SMA. You have referred to this before in your previous posts but it took until now to "get" it. Your response was very supportive to all involved.

I have a question about using the system with the daily graph - do you use the motion in relation to the moving averages on the dailythe same way as you do with the MA's on the 4hr? using the same rules? and are you still testing it?

Doji - I admire your dedication and loyalty to Phillip and his system, this is such a great forum! all responses are of value so dont hold back. Were all learning
O'Zeeke
 
 
  • Post #5,166
  • Quote
  • Jun 17, 2007 10:12am Jun 17, 2007 10:12am
  •  Palmer
  • | Joined Apr 2005 | Status: Cruising The Outer Rim... | 2,175 Posts
I put myself through a 'refresher course' this weekend and did the following:

I marked every new day, 00:00 according to FXDD whom I trade with, with a vertical bar just as a point of reference as to what time the chart is and because I'm still working on a breakout system. I went back to the first trading day of 2007 up until the present and printed out the charts. This came to about 13 pages in all. I did this for the EURUSD and the USDJPY. I zoomed in on the charts so there are about 8 to 9 days of data per chart. I made notes on the charts where the Rb's, Rt's and Tc's occured and picked up on a few things. The following 4 hr chart is from the USDJPY from about 4/17 to 4/30. I'm posting this chart because it has a few examples of some good note taking. It seems as if when a Vb or Vt occurs (the range of the price bars are quite large vs. the previous one(s) due to a news event or the like and the R:R is way out of wack) price action settles and a 'normal' Rb or Rt occurs a few bars later with a more acceptable R:R. Also, when the 8/21/89 MA's are converging a price channel will form and you should be diverging. Meaning, wait for the price action to exit the channel before planning a trade. You can either trade the breakout or wait for a Tc after the breakout. There are numerous 'false entries', or at least that is what I see, where the Rt's and Rb's are forming just around the zero line of the MACD. Again, wait for price to exit the channel. I've also noticed that when two or more of the 4hr bars are forming their own support and resistance levels (two or more price bars have the same, or within a few pips, high and low) that trading that breakout with the trend can get you in sooner and have a better R:R vs. waiting for the actual Tc signal on the MACD. Printing the charts out reaffirmed the FACT that price targets to the 8 and 21 area after a Rb or Rt occurs and it is a counter trend trade is most likely all your gonna get. Move your 'trailing lots' to break even and let those be the ones that close above or below the 21 and head to the 89 and keep chugging along....

I think you get a whole lot more out of this if you print the charts out and actually put pen to paper vs. doing it on the screen. When your brain and hand do this together your more keyed in on thinking about the method instead of looking at the menu bar and trying to select the correct tool to draw with. I've found a few other gems as well by actually writing the notes on the charts instead of on the screen. There's a wealth of information staring at you right in the face. PUN INTENDED!!!

Trade well friends...
Attached Image
 
 
  • Post #5,167
  • Quote
  • Jun 17, 2007 10:38am Jun 17, 2007 10:38am
  •  Phillip Nel
  • | Commercial Member | Joined Nov 2006 | 2,223 Posts
Quoting O'Zeeke
Disliked
Thank you Phillip for the explianation of the EMA and SMA. You have referred to this before in your previous posts but it took until now to "get" it. Your response was very supportive to all involved.

I have a question about using the system with the daily graph - do you use the motion in relation to the moving averages on the dailythe same way as you do with the MA's on the 4hr? using the same rules? and are you still testing it?

Doji - I admire your dedication and loyalty to Phillip and his system, this is such a great forum! all responses are of value so dont hold back. Were all learning
O'Zeeke
Ignored
I have live forward tested the daily for 2 months and got 656pips using the exact principals as the 4H system. One just need a lot of patience during an open position as a 50 gain can turn in a 70+ loss before going in the right direction and produces the desired results. Stoploss is between 100-150 pips. Market motion is very important and position entries must be very selective.
Phillip
 
 
  • Post #5,168
  • Quote
  • Jun 17, 2007 11:07am Jun 17, 2007 11:07am
  •  Phillip Nel
  • | Commercial Member | Joined Nov 2006 | 2,223 Posts
Quoting Palmer
Disliked
I put myself through a 'refresher course' this weekend and did the following:

I marked every new day, 00:00 according to FXDD whom I trade with, with a vertical bar just as a point of reference as to what time the chart is and because I'm still working on a breakout system. I went back to the first trading day of 2007 up until the present and printed out the charts. This came to about 13 pages in all. I did this for the EURUSD and the USDJPY. I zoomed in on the charts so there are about 8 to 9 days of data per chart. I made notes on the charts where the Rb's, Rt's and Tc's occured and picked up on a few things. The following 4 hr chart is from the USDJPY from about 4/17 to 4/30. I'm posting this chart because it has a few examples of some good note taking. It seems as if when a Vb or Vt occurs (the range of the price bars are quite large vs. the previous one(s) due to a news event or the like and the R:R is way out of wack) price action settles and a 'normal' Rb or Rt occurs a few bars later with a more acceptable R:R. Also, when the 8/21/89 MA's are converging a price channel will form and you should be diverging. Meaning, wait for the price action to exit the channel before planning a trade. You can either trade the breakout or wait for a Tc after the breakout. There are numerous 'false entries', or at least that is what I see, where the Rt's and Rb's are forming just around the zero line of the MACD. Again, wait for price to exit the channel. I've also noticed that when two or more of the 4hr bars are forming their own support and resistance levels (two or more price bars have the same, or within a few pips, high and low) that trading that breakout with the trend can get you in sooner and have a better R:R vs. waiting for the actual Tc signal on the MACD. Printing the charts out reaffirmed the FACT that price targets to the 8 and 21 area after a Rb or Rt occurs and it is a counter trend trade is most likely all your gonna get. Move your 'trailing lots' to break even and let those be the ones that close above or below the 21 and head to the 89 and keep chugging along....

I think you get a whole lot more out of this if you print the charts out and actually put pen to paper vs. doing it on the screen. When your brain and hand do this together your more keyed in on thinking about the method instead of looking at the menu bar and trying to select the correct tool to draw with. I've found a few other gems as well by actually writing the notes on the charts instead of on the screen. There's a wealth of information staring at you right in the face. PUN INTENDED!!!

Trade well friends...
Ignored
Info
Attached File(s)
File Type: zip Info.zip   843 KB | 1,577 downloads
 
 
  • Post #5,169
  • Quote
  • Edited 12:37pm Jun 17, 2007 12:20pm | Edited 12:37pm
  •  tamkras
  • | Joined Jan 2007 | Status: My piggy bank loves pips, too | 305 Posts
Quoting tamkras
Disliked
Kappa, I will get back with my musings later today or over the weekend. there is so much happening in the market and apologies for the delay.

Tam
Ignored
After reading multiple posts on FF and fx analysis elsewhere it seems like everyone accepts the idea of dollaryen going beyond 125.00 level. These 'forecasts' just differ in their potential targets - 125.00, 128.00, 134.00, etc. Honestly, I could not find a single analysis stating to the contrary (please, help, if you stumble upon one). That's where I see the problem. No one questions 'masters', analysts and other gurus. So, let's buy into this unique lulliby to the yen. Again, I may seem to contradict with my earlier bullish posts and somebody should tell "go back to the cave, lady. you do not belong here." This time I will post something that may only further fuel this public anger against 'the ugly Betty'.

I worked over Ira's question posted recently and worked hard. I know many asked me about the technical definition of IT/IB and while I proved many times in my trading experience (here on FF, too) that it works well with daily and lower timeframes I never studied thoroughly the higher timeframes - well, there are just 2, weekly and monthly. The picture there is different. Ira's question was valid. There are substantial 'hollow' caves in the preceding tops or bottoms which the price seem not able to fill and fibo retracement levels may be of higher precision. What I noticed, anyway, was if I measure this very failure as an objective than I could take it as the next target. My interpretation of the measured objective (there are tons of books on this concept) was extended for this case of study. Anyway, I enclose the monthly chart but I used the weekly for analysis. Sorry I can't post the weekly due to its size.

I put lines at the tops and highest lows of these tops (Pips coined them as 'ITL'). Yes, there are big cracks between them. I tried to be very meticuluous in placing these lines, no slopes, no adjustments. Well then. What I did next was to measure these cracks, or hollows. There are 2 of them. And these 2 were measured to have 900 pips. If you do not agree, take a ruler and do it for yourself. Now, you can see where this crazy scenario of mine is leading. Do not take me wrong - I am just doing an analysis and nobody paid me to do this.

So, what next? 2 dollaryen objectives were met, so to say, with 900 pips spread. The 3rd one is coming to test the validity of this objective. In other words, 133.04 minus 900 is about 124.04! I was simply shocked. But do not tear me into pieces as I am not a Galileo woman. I just want to see if there is a toppish formation at this level to confirm the scenario. That's all. Have a great weekend.

P.S. I thank Phil for the opportunity to discuss these ideas on his forum some of which may be more of a theoretical value.

P.P.S. In the hindsight, Ira, why didn't you ask the same question the last February? Oh, never mind. Big lost opportunity..
Attached Image
 
 
  • Post #5,170
  • Quote
  • Jun 17, 2007 1:35pm Jun 17, 2007 1:35pm
  •  ira
  • | Joined Mar 2007 | Status: Member | 667 Posts
Tamkras, Pips, Phillip, Palmer - thank you for your excellent posts, and hard work, let it come to you back with million of pips!
I have made my homework for the next week on E/U (I am focused only on this pair at the moment, due to the kind Pips advice), so here it comes.
On the daily chart, the price has gone through 89 and now goes back to the 21MA with the rules of market rhythm.
On the 4H chart, the price has gone through 21 and goes to the 89MA without retracment. We have the following resistance levels on the 4H chart (they correspond to the daily levels): 1. price level 1.3400; 2. 50 level Fib.; 3. weekly TL; 4. 89MA. They all meet approcimatly at the level 1.3410. So we can have the following scenarios:
1. The price will come to the level 1.3410, then there will be RT (even double top) on MACD, then we can go short.
2. The price may not come to the level 1.3410 but retrace from 1.3400 with VA on MACD.
3. The price will not bounce from 89 but will go through it and 365 to the 200MA then we will have TC signal on MACD.
So anyway I should wait for MACD signal to tell me what to do.
Please, any comments are welcome.
Attached Image (click to enlarge)
Click to Enlarge

Name: 3.gif
Size: 19 KB
 
 
  • Post #5,171
  • Quote
  • Jun 17, 2007 3:35pm Jun 17, 2007 3:35pm
  •  lerner
  • | Joined Jul 2006 | Status: Member | 37 Posts
Quoting tamkras
Disliked
Again I am looking at usd/jpy (or joy ). After the disappointing US home sales is there some re-arrangement of market forces? Who can predict the next move? A rhetoric question, of course. In the meantime, following MACD 4 hr signal and some other observations, I will try to see what happens in shorting usd vs joy (sorry jpy). I have no idea if it will end up in profit or loss but it is worthwhile playing unless the pair breaks out the shield that I showed. Breaking the shield will require an immense energy, so will follow that force if and when...

Yours Tamkras
Ignored
Tamkras,

Is that shield a drawing indicator on MT4 platform? If so could you please direct me where to find it?

Thanks
Lynn
 
 
  • Post #5,172
  • Quote
  • Jun 17, 2007 5:46pm Jun 17, 2007 5:46pm
  •  tamkras
  • | Joined Jan 2007 | Status: My piggy bank loves pips, too | 305 Posts
Quoting lerner
Disliked
Tamkras,

Is that shield a drawing indicator on MT4 platform? If so could you please direct me where to find it?

Thanks
Lynn
Ignored
Hi Lynn,

The shield, a.k.a round top, which I showed is not from MT4 platform. You might have noticed that I used other rounded, or curved lines which I borrowed from Visio. I justed needed perfect rounded or elongated formations. I first spot them on the clean chart and then overlay a figure which you saw on the posted image. Hmm, I liked that post!
 
 
  • Post #5,173
  • Quote
  • Edited 10:10pm Jun 17, 2007 8:45pm | Edited 10:10pm
  •  FaholoFX
  • | Joined May 2006 | Status: Member | 74 Posts
Hi again everyone! I'm wondering if anyone else here that has been following Phillips strategy has GFT as a broker. The reason I'm asking is because I'm not gifted whatsoever in programming, but I'd be really interested in a custom MACD similar to the one created for MT4. I can't imagine it would be too difficult, but I'm kind of hoping that maybe someone has already created one that they wouldn't mind sharing. PM me if you have one or have any knowledge in the GFT programming language (which is .ctl).

Thanks,

Cope
 
 
  • Post #5,174
  • Quote
  • Jun 17, 2007 10:28pm Jun 17, 2007 10:28pm
  •  BeachBum
  • Joined Oct 2005 | Status: Trade the MAX System with me... | 1,995 Posts
Hello Phillip.....

So many people have come to FF, started a thread, touted "their system" and then ran for cover when the going got tough or they had cultivated a following that was now willing to pay for additional mentoring. It is sooooo refreshing to see someone like yourself putting in the time regularly on the thread you started six months ago to help fellow traders be successful, fielding the questions and adding nuggets of trading wisdom along the way. I read here regularly and this post in particular caught my attention because I am mainly a Daily chart trader. But my primary reason for posting was to commend you for your efforts in behalf of others.......truly a job well done! I admire your committment to helping others.


Quoting Phillip Nel
Disliked
I have live forward tested the daily for 2 months and got 656pips using the exact principals as the 4H system. One just need a lot of patience during an open position as a 50 gain can turn in a 70+ loss before going in the right direction and produces the desired results. Stoploss is between 100-150 pips. Market motion is very important and position entries must be very selective.
Phillip
Ignored
 
 
  • Post #5,175
  • Quote
  • Jun 17, 2007 10:36pm Jun 17, 2007 10:36pm
  •  yellowbrick
  • | Joined Jun 2007 | Status: Member | 32 Posts
short @ 3387. go to bed and be back tomorrow moning.

yb
 
 
  • Post #5,176
  • Quote
  • Jun 17, 2007 11:11pm Jun 17, 2007 11:11pm
  •  lmark
  • | Joined May 2007 | Status: Member | 20 Posts
Ok, just trying to understand. Price has come down through the 89, and now back up toward the 89 (testing it). If price bounces down off the 89 and we have a macd signal, then we would go short right? Profit target would be between the 8 and 21 correct? I hope I don't sound stupid..........I am trying to learn as much as possible.

Thanks to all who help so much.

Larry
 
 
  • Post #5,177
  • Quote
  • Edited Jun 18, 2007 3:37am Jun 17, 2007 11:26pm | Edited Jun 18, 2007 3:37am
  •  sgfxtrader
  • | Joined Jun 2007 | Status: Member | 32 Posts
Hi Phillip!

I am from Singapore.
I have come to know this forum through goggle.
I have read some of your articles and I am very impressed by it!
I am now trying to get through all the articles in the forum and hope to have a better understanding of your powerful system.

So far, the backtesting of it on June 2007 from 1st June to 15 June, I would have > 300pips gain already! WOW! :

I am still a newbibe in trading... Now trying out EUR/USD using practise account.
Today: Short at 1.3387 at the point of writing. Stop-Loss at 1.3405. Target Price... uncertain yet.
* Singapore Time:1540hrs - Got Stop out. <<I would need to learn how to set a good Stop-Loss ya.>>

Thank you for the effort in sharing your idea of trading. Looking forward to hear more from you!
 
 
  • Post #5,178
  • Quote
  • Jun 18, 2007 7:01am Jun 18, 2007 7:01am
  •  lerner
  • | Joined Jul 2006 | Status: Member | 37 Posts
Hello Everyone,

I am trying to put the Daily Pivot Calculator (pivot/ M1/ M3/ etc) on my 1 hour chart and what I see is a bunch of clustered lines.

I am supposed to change the setting or anything on the indicator each time I open it?

Your help is much appreciated and thanks in advance!

Lynn
 
 
  • Post #5,179
  • Quote
  • Jun 18, 2007 7:18am Jun 18, 2007 7:18am
  •  pips4uandme
  • | Joined Feb 2007 | Status: Member | 989 Posts
Hi sgfxtrader and yellowbrick,

Welcome to the forum! Also, sgfxtrader, nice job on your few weeks of backtesting! Great Job!! Keep trading the way you tested!

I have a question for you guys, because you shorted E/U earlier....Did your 4 hour give a lower high on the MACD indicating short confirmation? My chart package has MACD rising all night and thus did not confirm short trade.

I know that charting software has different candle close times, and signals may differ. It seems to me that people are using the 1 hour as the trade signal and that this could have happened for shorting E/U....?? Could you please clarify for me where your confirmation came from? Really appreciate it!

Pips
 
 
  • Post #5,180
  • Quote
  • Jun 18, 2007 7:25am Jun 18, 2007 7:25am
  •  pips4uandme
  • | Joined Feb 2007 | Status: Member | 989 Posts
Handymann,

Wanted to commend you on the testing you have been doing! Great Job!

Someone (I don't remember who, sorry) brought up a point of overoptimizing and the problem w/MACD signal changing in live market.

This made me think that some of the newer members may not be waiting for the close of the candle to place their trades. It is very important to trade in the direction of the 4 hour MACD signal and wait for the candle to close before entering based on the signal.

Also, if you wait for a closed candle, when you are doing your backtesting, the trades are determined exactly the same as when trading live (except w/out the real money emotion coming into play). You will see how your method of determing entry has worked out and how you may expect it to work in the future. This isn't, IMO, overoptimizing, instead it is practicing and learning to see the market action. Of course, I'm a big believer in practicing and reviewing our trades! Think it is GREAT that you are taking the time to focus your efforts on developing your edge!!!

Happy trading,
Pips
 
 
  • Commercial Content
  • /
  • 4 Hour Strategy (MACD)
  • Reply to Thread
    • 1 257258Page 259260261 1578
    • 1 Page 259 1578
0 traders viewing now
  • More
Top of Page
  • Facebook
  • Twitter
About FF
  • Mission
  • Products
  • User Guide
  • Media Kit
  • Blog
  • Contact
FF Products
  • Forums
  • Trades
  • Calendar
  • News
  • Market
  • Brokers
  • Trade Explorer
FF Website
  • Homepage
  • Search
  • Members
  • Report a Bug
Follow FF
  • Facebook
  • Twitter

FF Sister Sites:

  • Metals Mine
  • Energy EXCH
  • Crypto Craft

Forex Factory® is a brand of Fair Economy, Inc.

Terms of Service / ©2023