There's a lot of Gann doubters out there and that is because of a number of reasons, the main one is that they don't put enough time into research and then complain that his methods don't work! and they expect everything to work on every chart they look at - markets work out to differing cycles (planets), hence why you get differences and have to do the work for every market you look at!
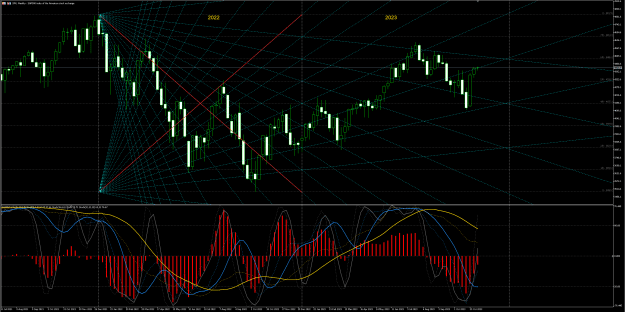
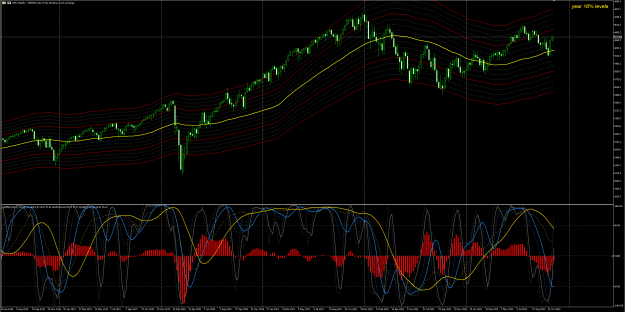
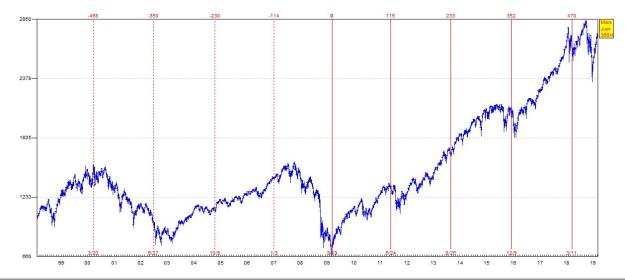
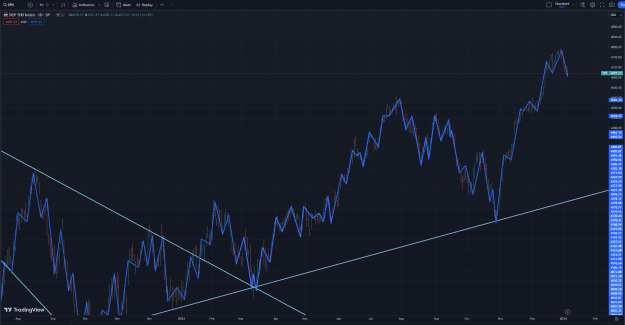
This chart shows the SP500 Index - it contains a huge amount of Information, that is proved by geometric evidence and mathematics that cannot be argued with:
This chart shows the SP500 Index - it contains a huge amount of Information, that is proved by geometric evidence and mathematics that cannot be argued with:
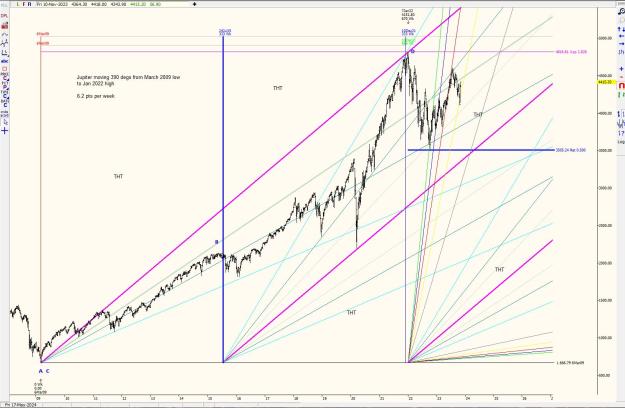
Attached Image (click to enlarge)
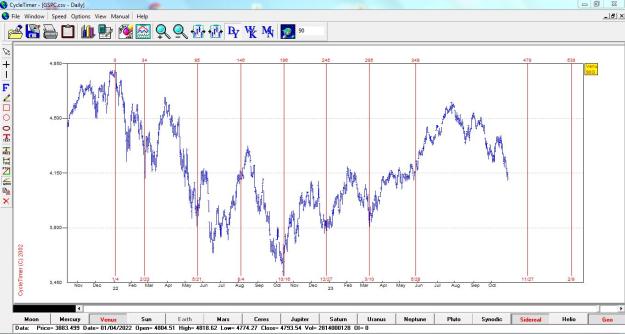
- Simple conversion of the March 2009 low PRICE into TIME - 666pts = 666 WEEKS
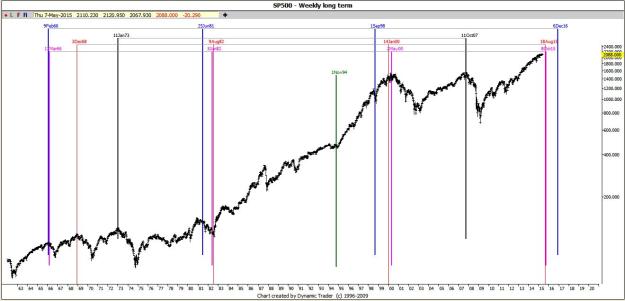
- Split the 666 WEEKS into 2 or 50% or 180 degs = works nicely
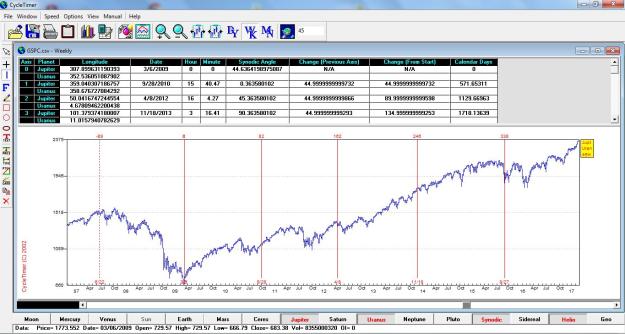
- Link 666 weeks to a planetary cycle - this one works out to 390 degs (so 360 degs + 30 degs) of Jupiter
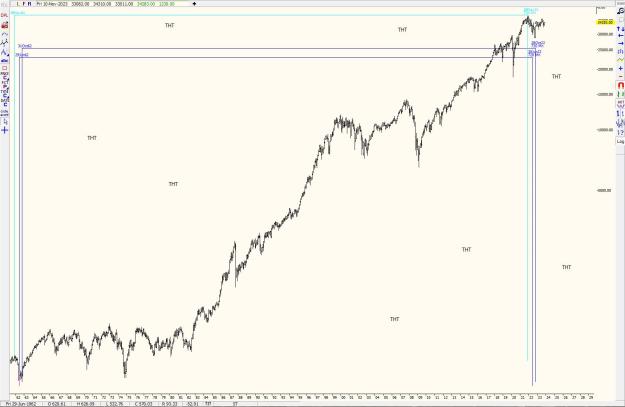
- Markets often run GEOMETRIC ratios of the SQUARE (1.4142), the CUBE (1.732), Fibonacci (1.618) & 2 adjoining squares (2.236) which are also Sq root of 2/3 & 5
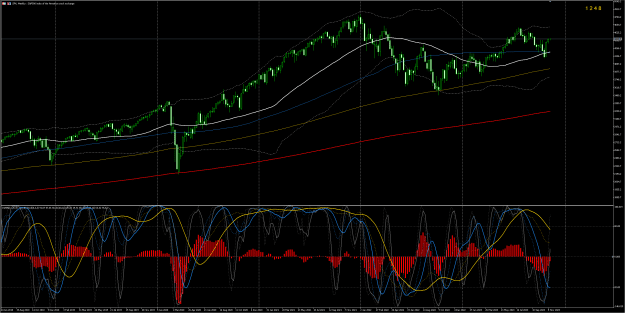
- The ABCD calc was from the EXPANDING GEOMETRIC ratios of the SQUARE - not shown but also landed within 1 point of the high was a ratio of 1.902 of swings from the 2016 lows (1.902 is the DIAGONAL of a GOLDEN RECTANGLE (Fib series)
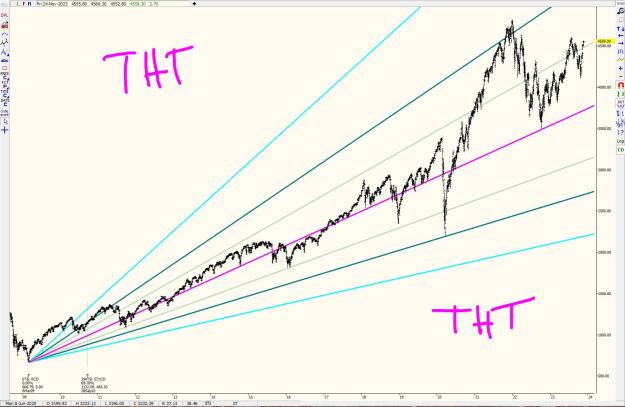
- Now onto the Gann Angles - Back in 2009 you would NOT have known the growth rate of the market, so you would of had to put some experimental ones on the chart, then once price moved along in TIME, you could have tweaked to "fit" - The point here is to show HOW the SP500 the PRECISION as to how the SP500 GREW - Humans are not that clever, to be able to force a market to have grown with this precision over 13 years - look at all the mathematics involved, proved on the chart
- WD Gann said "Once an angle is breached, it falls to the NEXT angle" - Which if you look at the chart is what happened perfectly!
- Notice that at the 180 degs / 50% of the overall cycle I repositioned the Gann Angles, to which they caught the price falls - as I've moved the angles FORWARD in TIME by 50%, the 2 x 1 (Bright Blue) hits the 1 x 1 (Bright Pink) from 2009 - shows that the angles are sync'd properly and notice how from the end of the cycle date and Jan'22 high the angles have nicely sliced through price rallies
- and low and behold look at the pink 1 x 1 angle from 2015 projection - stopped price perfectly - I have to say price also FELL within 0.01% of exactness/perfection 35.4% and 35.4% is a ratio of the SQUARE
- This is why Gann used all those squares, grids, angles etc etc etc, so that he could visualise GEOMETRICAL shapes the markets are moving to
- Go back in history and MEASURE price falls - 50% = SQUARE / 57.7% = CUBE / the 2009 price low fell EXACTLY 57.69% which is close enough to perfection for me or 57.7%
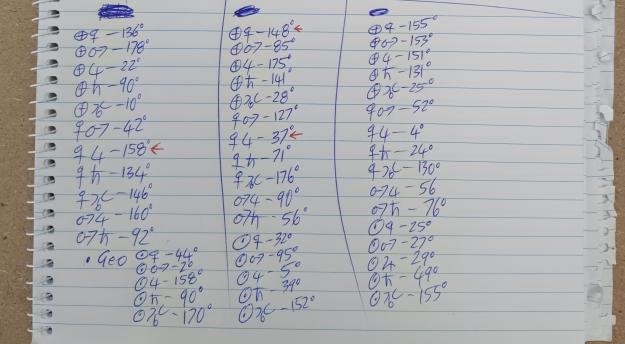
- As we can easily prove that PLANETS are responsible for the TIME aspect, at key turning points, then somehow, humans are doing the bidding work of those vibrations/messages from planets to BUILD GEOMETRIC structures provable by mathematics that we can't argue with, on the worlds main stock markets! Sound crazy I know, but the more you Investigate this area, you soon become a convert
So when people say that the markets are random, they just have not looked properly
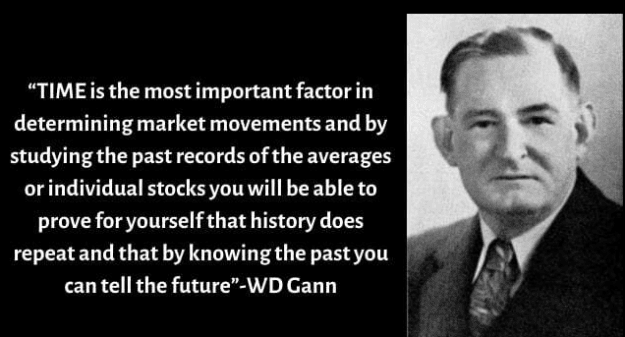
Once you find the Planet that the market is working out to - it will work for YEARS until is all squares up and balance price and time and then it turns
THT
1