Hello,
read carefully here:https://www.forexfactory.com/thread/...-likes14043922 post n°4530
I no longer wrote in that 3D because I didn't like some things written by someone.....but if you have the patience to read well...you too will find a way to scale the MT4/MT5 chart
Another interesting technique I learned from reading Jenkins is this: I take the last downswing swing and draw the circle from the bottom. then I draw a second circle that has a radius exactly double the first
I'm writing this to explain the image from the previous post so everyone can understand it
another very nice signal given right now on EURUSD 15 min scaled chart. it just rested on the angular trendline 1/2 of the way up at 44.5° (just missing 45°) the time of this inversion was given by the crossing of the diagonals of the small square
nice climb...
my thought: geometric figures are able to provide temporal reversal signals a long time in advance, the trader knows in advance the moment of a "possible" reversal
{quote} Hi everyone, carbonmimeti, Thank you very much for sharing your knowledge, screenshots and point of views. In the past, after watching the videos available from Jenkins, I started to play with the tools that jeanlouie shared here with generosity and I thank him very much for it. I knew that I needed more clues to assemble the puzzle, that I just start to see now after your posts!! The Pitchfork "starting from VESICA PISCIS" in order to draw the 3 parallel lines, to find the "Eye of Piscis" that is "being crossed by the middle parallel",...
Ignored
Hello Hanxyork,
since you are the only one who understood the importance of the PITCHFORK, I'll give you another image of EURUSD 15 min in which you can see that the PITCHFORK drawn on the Vesica coincides with the angular trendline...so we have a double resistance
nice climb... my thought: geometric figures are able to provide temporal reversal signals a long time in advance, the trader knows in advance the moment of a "possible" reversal {image}
Ignored
Hi carbonmimeti
Good Morning from America!
Thank you very much for sharing this amazing way to trade with Geometry.
From your posts, I can tell that I am short on tools, in order to analyze on the charts accordingly to your teachings, let me take a look for the missing tools, inside this thread.
{quote} Hi carbonmimeti Good Morning from America! Thank you very much for sharing this amazing way to trade with Geometry. From your posts, I can tell that I am short on tools, in order to analyze on the charts accordingly to your teachings, let me take a look for the missing tools, inside this thread.
Ignored
don't worry...as soon as I have 5 minutes I'll upload the geometric indicators
USDJP 15 min chart from the vector AB (length of the side of the square) I mathematically obtain the length of the Vesica (blue line) then I calculate all the other ratios. black line= side of the square, gray line= double the side of the square, red line= diagonal of the square , blue line= diagonal of the rectangle. In practice, these lines give me the future turning points ... I have to figure out exactly which swing to start them from ... obviously now I put them by experimenting but the nice thing is that each line intercepts a turning point...
Ignored
This would be a great help, for sure.
When you get a chance, could you tell more about this post, I mean what are the key factors, calculations or formulas needed on this step? This looks like the first to be taken, before we start drawing on the charts.
By the way, I am a huge fan and follower of Leonardo Bonacci or Fibonacci, Leonardo di ser Piero da Vinci, Ferrari, Lamborghini, Carpigiani, Italian Gelato Artigianale and the list continues...
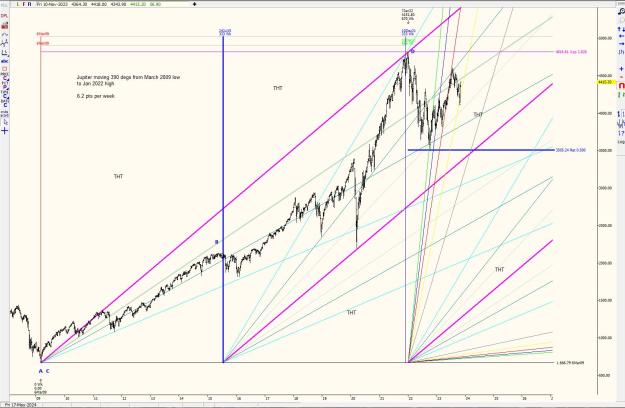
Converting price into TIME (WEEKS)
Planetary angle and use of a planet (Low to High range)
Copy of planetary angles (Copy 1 x 1 and the rest automatically fit), place from 666 low at each TIMING point = great fits to price action
Jan 2022 TOP/HIGH was 1 point of PERFECTION of the AB range from C x expansion ratio of a SQUARE 2.828 = D
EDIT - look at the % FALL of the 2020 plunge = 35.4% - this is the exact INVERSE of the ratio 2.828 of the square - markets never stop dead on some random number, retracement or % fall for no reason - the SP500 2009 LOW fell EXACTLY 57.7% - 57.7% is tan30, but also its a ratio of the CUBE sq rt3 value
Multiple Gann methods on the SP500 Index Converting price into TIME (WEEKS) Planetary angle and use of a planet (Low to High range) Copy of planetary angles (Copy 1 x 1 and the rest automatically fit), place from 666 low at each TIMING point = great fits to price action Jan 2022 TOP/HIGH was 1 point of PERFECTION of the AB range from C x expansion ratio of a SQUARE 2.828 = D {image} THT
Ignored
I see you are using DYNAMIC TRADER...me too in real time linked to mt4...very good software
{quote} This would be a great help, for sure. When you get a chance, could you tell more about this post, I mean what are the key factors, calculations or formulas needed on this step? This looks like the first to be taken, before we start drawing on the charts. By the way, I am a huge fan and follower of Leonardo Bonacci or Fibonacci, Leonardo di ser Piero da Vinci, Ferrari, Lamborghini, Carpigiani, Italian Gelato Artigianale and the list continues...
Ignored
please read my post n°10325.....it all lies in the calculation of the right triangle/radius of the circle.
1) MATHEMATICALLY calculate the length of the hypotenuse of the right triangle
2) multiply by the root of 3 to obtain the length of the VESICA
3) multiply the hypotenuse by 2.236 to obtain the length of the diagonal of the rectangle
you can find the mathematical formulas to build the VESICA and all the ratios it contains freely on the web....but you have to multiply the result by the price/time ratio...the same ratio you use to scale your graph .
I reply publicly to your private message: No indicator or software is needed to scale the MT4/MT5 chart it is scaled manually and once the scale is fixed it always remains the same. I change it ONLY when volatility explodes and therefore the price goes "off scale" (exits the video) and therefore I restrict it by increasing the number of pips. example: if with low volatility the price/time ratio is 1/1 (100 pips per 100 bars), if volatility explodes I put 200 pips per 100 bars. obviously these are fantasy numbers... I only use them to make the concept clear
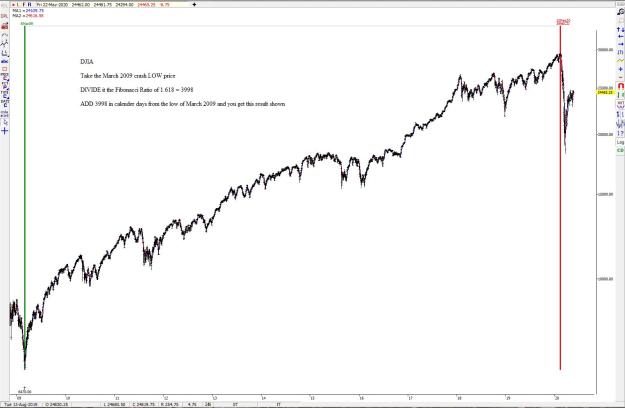
Gann square outs: Time and price balance in the markets EDUCATION | 08/21/2022 22:00:00 GMT
Share:Share on TwitterShare on FacebookCopy to clipboard by Jeff Greenblatt
The trading community is relentless in its pursuit to find out how and why the market turns. Bull and bear markets surge relentlessly along their path until one day they reverse course and set sail in an entirely new direction, never looking back. Markets march to their own drummer with a language all their own.
Certainly, fundamental valuations play their part in determining where we might be in the cycle. A price/earnings ratio can tell us whether the market, or particular stock, is cheap or expensive at a specific point in time, but it has zero capability of telling us when the turn will come.
To solve this riddle, many turn to technical analysis. Technical analysis is the study of price patterns and the visual representation of emotion in the market. Examples of key technical tools are moving averages, trendlines and Andrew’s pitchfork. While these are important indicators, markets can and will overshoot their technical target, and the study of patterns can give us only a rough idea of when and where a market might turn.
So if fundamental and traditional technical analysis can’t nail the turn consistently, what can?
One class of analysis methods that works over time involves the studies of W.D. Gann. These techniques have proven instrumental in pinpointing and explaining market tops and bottoms. While it’s not always clear why a time and price symmetry identified a market turn, such symmetries do indeed exist. Gann, a well-known analyst from the first half of the 20th century, considered the squaring of price and time his most important discovery. He called it range and time squared.
In short, when the duration of a move squares with the extent of a move, price trends tend to change. On that high level, it’s simple. However, the proper application can be tricky. In “W.D. Gann’s master forecasting methods,” (February 2011) we examined several aspects of Gann analysis. Here, we’ll delve deeper into time and price studies.
Discovering detail
Markets are enigmas, and this attribute demands a great deal of flexibility when working with price and time studies. For example, a common manipulation is the decimal point — a Dow range of 7,728 points can square with a rally 77 weeks down the road. A 21-year, 1,108-point range in a market could identify a turn 1,108 weeks later — as it did with the 1987 stock market crash. However, as complex as this appears, markets can get even more complicated. But as it is with the study of pivots, the Gann calculations themselves are decidedly simple.
Take, for instance, the 2011 bear market in the BTK Biotech Index (see “Tech crunch,” below). The peak of this market was on May 13, 2011, with a price of 1514.60. The bottom came in on Nov. 25, at 1,001.33. The exact range is 513.27 points. What was the date of the high? It was May 13, or 5-13. The market had a range that was equal to the date of the origin of the pattern. This is just another example of how Gann’s principle of time and price balance out.
What should be understood about this mystery is it does not materialize every day. However, when it does, it usually leads to a powerful trend, as it did in the case of BTK. Going back to our ’87 crash example, consider the stock index price rise that followed the bottom.
Another progression in the study of price and time work is the square root. In the case of the BTK, the first important pullback in the bull move off the Nov. 25 low came at 1,427.26. On the surface, that means absolutely nothing. However, when we take the square root of that figure, we get 37.77, which Fibonacci enthusiasts will recognize as the derivative of 377.
The simple square root, which we all learned in grade school, is an integral hinge on which the markets turn, but because it’s hidden just under the surface, it’s not immediately apparent. Consider the Dow sequence from the March 2009 bottom to the May 2011 high. The high on May 2 was 12,876, after a bottom on March 6, 2009. The 12,876 numeral doesn’t seem so important by itself until we take the square root, 113.47, and discover the market peaked in the 113th week of the rally. That May high also was the day after the United States military killed Osama Bin Laden. The media was expecting a nice rally off the news; however, that was the day markets peaked for the year. Other markets had their own calculations, but this was how the Dow contributed to the peak and led to a grinding 108-day correction, which ended in October.
The all-important BKX also bottomed in early October, and the dog of 2011 has been one of the outstanding market leaders of 2012 (see “Banking on it,” below). How did this happen? One assumption might be that time heals all wounds and that enough time had elapsed from the financial crisis so the investing community finally became interested.
However, the banks peaked at 58.81 in their 59th week of the rally. The square root of 58.81 is 7.66. The peak on April 21, 2010, to the low of Oct. 4, 2011, is exactly 75.85 weeks, and by the plus-or-minus-one rule of market timing, it is close enough to 76. Once again, Gann came through as investors and traders have enjoyed the best rally since the move off the bottom — even if they aren’t exactly sure why it happened. Notice that 76 also is a Lucas time series number and how several interim tops and bottoms match other Lucas numbers.
Analysis payoff
As hard as this analytical sleuthing appears, the rewards are worth the effort. All the trader needs is to find one key calculation on an important chart and leverage it out to the overall market. If BKX or BTK has a great reading, the entire market usually will respond. The square-root method is the next progression of analysis when simple price and time methods don’t uncover the symmetry.
Patterns can be found in stocks, as well. One of the better examples is the first rally leg in the new bull market for Alcoa (see “Metal mover,” below). Alcoa bottomed on March 6, 2009 at $4.97 and peaked on Jan. 11, 2010 at $17.60, 311 calendar days after the bottom. The square root of 311 gives us 17.63, only 3¢ off. It sold off for the next seven months. In the world of Gann, exact precision materializes many times, but close is good enough.
There are no coincidences. Gann and several generations of traders have used time and price analysis combined with square roots successfully. Some consider Gann to be the Holy Grail of trading. It’s not. What must be understood is that until there is a pivot — price action — there is nothing. You can spend a lot of time figuring out where a market is going to turn based on certain symmetries. It’s best to have a rough idea without spending too much time looking for a move that is not there.
For instance, because the SPX bottomed at 666, it doesn’t take much effort to look at 66 days or weeks, nor does it require much effort to figure out the square root is 25.8. In that way, the trader can be loosely aware that at 26 weeks, or 258 days, a turn might occur. But if not, there’s no harm — trades should not be placed in anticipation of Gann moves prior to price confirmation. On the other hand, this methodology becomes valuable when an important price pivot has materialized.
Also, this isn’t a trading method where you look for entries simply because a square root lines up. There is a macro and micro picture. One of the biggest stories in financial markets in 2011 was the expectation of so many equity euro bears that Greece would lead to the next Lehman moment. It never happened because too many traders allowed themselves to be ruled by their emotions and did not really understand the importance of cycles.
Before attempting trade entry, you need an edge that gives you confidence that you are on the right side of the market. Once that is established, you can use your own rules and discipline to find good entries. Gann will help and square roots certainly are an important piece of the puzzle.
Finally, consider the bear market low for the SPX at 666.79. It has an exact square root of 25.82. Go back 258.3 months, and we have the August 1987 peak before the crash on Aug. 25. This may finally explain the March 2009 bottom because the 1,108-point Dow range produced the NDX bottom on Nov. 21, 2008.
Take the same Dow bottom at 6469, and we get a square root of 80.43. The retest of the Great Depression low is recognized by market historians as the second most important low of the 20th century on April 28, 1942. That pivot is 802.3 months removed from the 2009 bottom, which is close enough to consider.
There is a checklist of conditions for discovering time and price squares:
Check the trading or calendar day count.
Look at the high, low and range to see if there is any symmetry. If something materializes, that will be good enough.
Keep an eye out for the requisite price pivots. If no signals emerge, take it one level deeper and work with the square roots.
Once the reversal materializes, you leverage in the trading instrument that flows with your data.
As you perform your due diligence, you might find something else, such as a specific date matching up with the range. Opportunities are out there. There might be something vitally important sitting just below the surface of your price charts. Gann time and price analysis and square roots can get you there.