I started this thread to post my analysis and real time trades as it happens. I used to post at Bella's Blue ( Cable (https://www.forexfactory.com/thread/1236070-bellas-blue-cable)) that is closed
For Information about Trend-0.25 please see the bottom of this page.
History as a Trader
I started trading in September end 2022 so basically i just completed my 1st year in OCT 2023 . I trade only GBPUSD and will stick to this pair for personal preferences ...
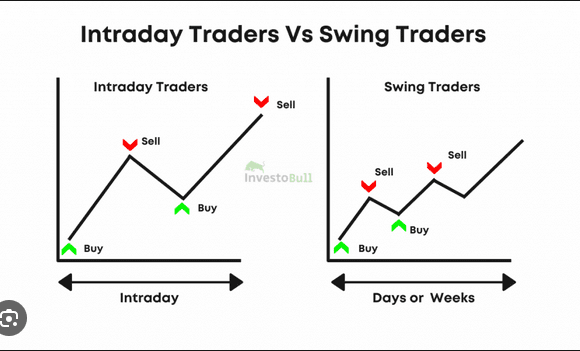
Comparison between Intraday and Swing Trading
Investing and Risk Reward
Investing is the practice of putting money into a project with the expectation of generating a profit or return on investment over time. The goal of investing is to make your money work for you by allowing it to grow and generate wealth. The risk/reward ratio is a helpful tool in investing that can help investors assess the potential risk and reward of a trade or investment.
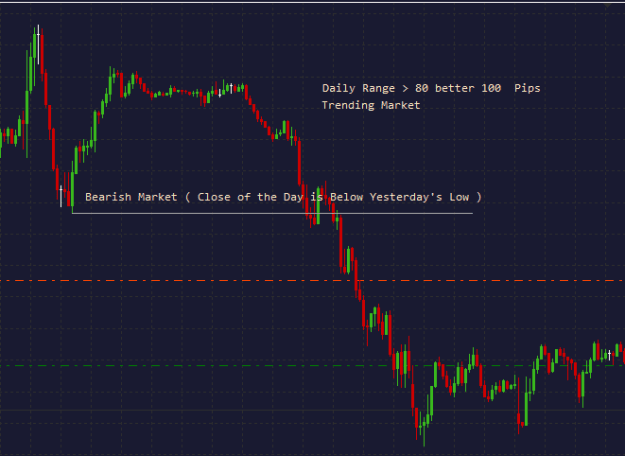
What is a Trending Market
In my books a trending market has specific personality so sometimes i mention about today is consolidative or trending.
Trending Market Characteristics
1. Daily Range is greater than 80 Pips , above 100 pips is better .( This is important since traders conviction requires movement in the direction of the trend).
2. Daily Close of Today is less than low of yesterday , (this is important since the trending market should reflect commitment of traders in the direction of the trend hence they like to close the daily below yesterday's low (Support level )
Note: all terms are used for Daily Bar.
see the image below. (12.04.2024)
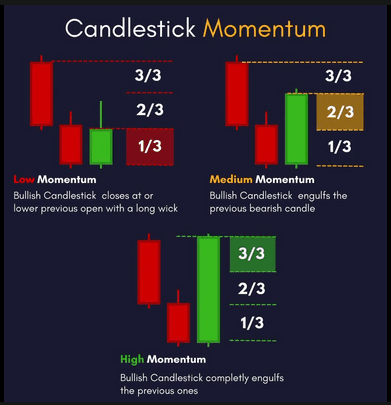
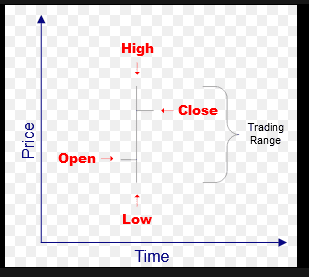
Bella's Candle Momentum ( used with Monthly Candle )
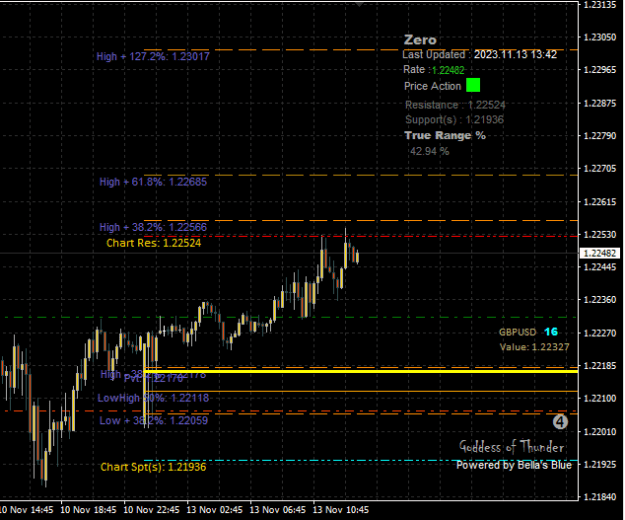
In my previous chart there are pivots such as High Pivot and Low Pivot so i will provide some information and why it is used.
The current close price or bid price for the Candle we are analyzing shows the sentiment of the market. Depending on where the price is within the high or low range.
In the previous chart the range is = 0.01891 which you could calculate by subtracting Months High with Month's Low.
High = 1.27087
C.Low = 1.25196 ( current low in analysis of the developing candle )
Range = 1.27087 – 1.25196 = 0.01891
Determining the current sentiment of the Candle in Analysis
We divide the candle into three parts namely
- Top 1/3
- Mid 1/3
- Bottom 1/3
Calculations are as follows
0.01891/3 = 0.006303
Lets divide the candle into 3 Parts
Top = 1.27087 – 0.006303 = 1.26457
Bottom = 1.25196 + 0.006303 = 1.25826
Mid = Between 1.26457 and 1.25826
Bullish Sentiment : if the current market is above 1.26457 it is considered as Bull Market ( momentum is bullish using price action )
Bearish Sentiment : if the current market is below 1.25826 it is considered as Bear Market ( momentum is bearish using price action )
Sideways Market : if the current market is between Top and Bottom it is considered as sideways market.
Advantage: By using the method above and with live candle update one can see, the sentiment of the market, including the support and resistance which needs to hold or break away and hold .
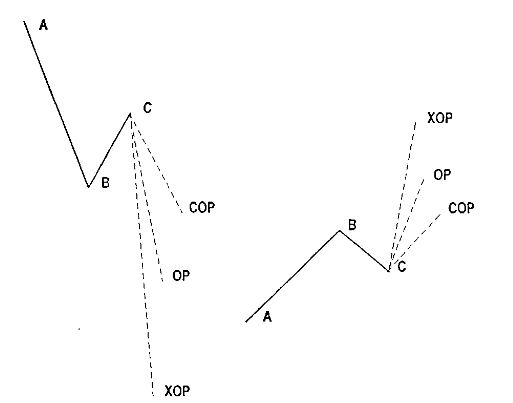
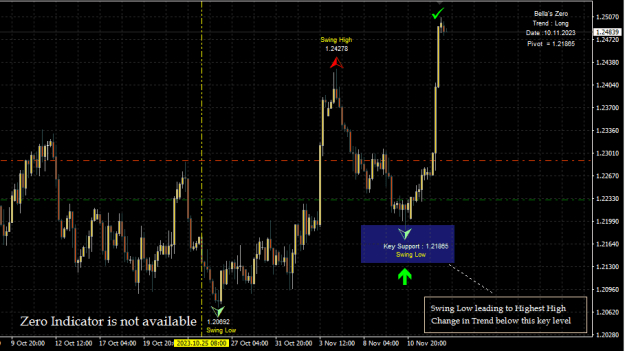
Fibonacci Expansion Analysis

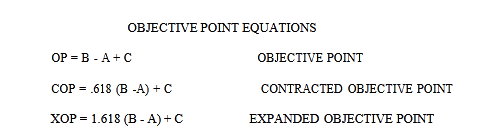
Equation are below

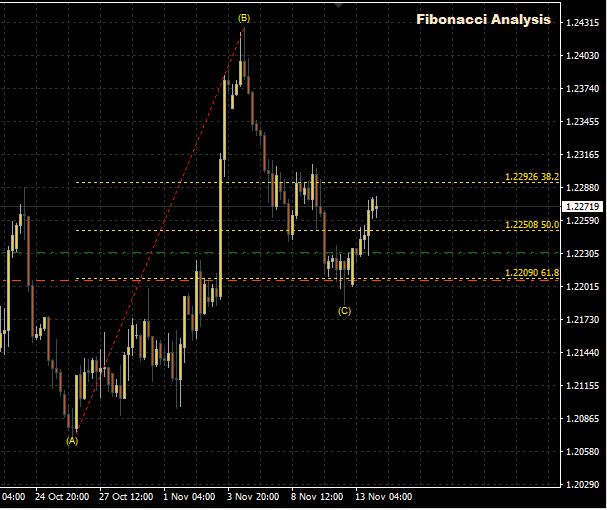
I have three values from 4 Hr Chart
A = 1.20692 ( Low of 26.10.2023 )
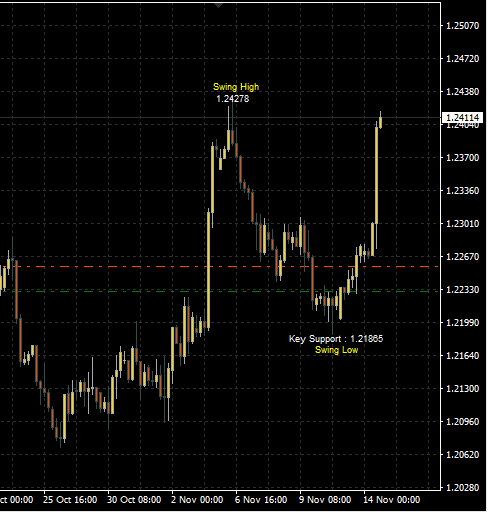
B = 1.24278 ( High of 06.11.2023 )
C = 1.21865 ( Low of 10.11.2023 )
I will just use it with the first Equation = OP so the calculated values are with Equation
Using the Objective Point Equation
OP = B-A + C
OP = (1.24278 - 1.20692 ) + 1.21865 = 1.25451
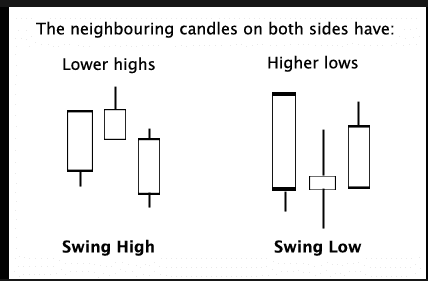
Swing High and Lows
A swing high is simply any turning point where rising prices changes to falling prices . I define a swing high (SH) as a price bar high , preceded by two lower highs (LH) and followed by two lower highs (LH) . ( Diagram Above ).
Likewise a swing low is simply any turning point where falling prices changes to rising prices. I define a swing low (SL) as a price bar low , preceded by two higher lows (HL ) and followed by two higher lows (HL) (Diagram Above ).
Many Traders like my self try to trade these SH and SL what they call in trading community "Picking Tops and Bottoms". This could be very nice strategy if you exercise stop loss with it .
( Note: there is no trading without stop loss - if they tell you something else just visit their home to see what they earn through trading also no hedging or averaging ) reason is? you are not actually forecasting anything period. Preferably your R/R should be on average > 2.0. ( It is another topic how to understand an effective trading strategy or write one ) .
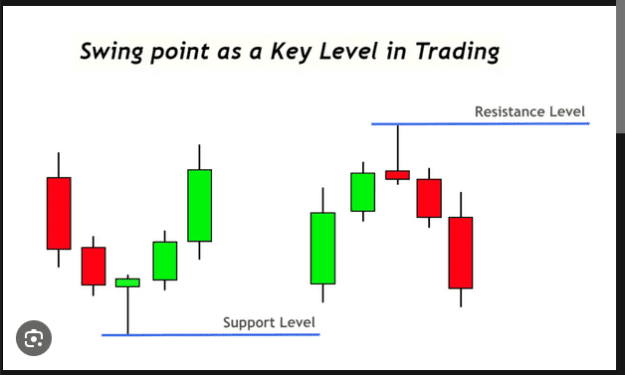
Other usages of Swing High and Swing Lows
1. These areas will also produce key support and key resistance areas which can be used while the pair is retracing or trending
2. Multi time frame analysis : It can help to see a Bigger Picture in context of higher time frame action. ( you could trade 15 min by looking at higher time frame structure say 60 min ).
3. Used to Create trends ( effective but depends on trader analysis ) one example is Bella's Price Action Analysis.
Bella's Swing Targets and Reversals
Swing Points
I will discuss the formula which can be used to calculate Swing High or Low Probable Support and Resistance areas.
Looking at my 4hr charts the High was made on 06.11.2023 with the price 1.24278 this is the swing high and we like to calculate what should be the swing low or a possible reversal point.
Note : we don't use any decimals in calculation to get the proper price points due to volatility or to omit any logical errors in price points so 1.24278 becomes 124278
Using Microsoft Windows Calculator ( we like to know the support area )
Calculation : High : 1.24278 what could be support?
Step 1 : SQRT (124278) = 352.53
Step 2 : 352.53 - 4 = 348.53
Step 3: 348,53 * 348,53 = 121473 or 1.21473
Current Low as of 10.11.2023 is 1.21865 which is close enough.
if you are looking for resistance you would add 4 in Step 2 not subtract 4 ( you could try 1,2,3,4,5,6 ) but looking at how GBPUSD trades default what i use to check when i need is 4.0. ( volatility )..
In Step 3 we multiply result from Step 2 with itself and the reason is how the square root works .. to get the original number.. if you are not good at mathematics no problem nor do i..
I made some fast calculations using the low of 10.11.2023 1.21865 ( 121865 ) and received 1.24674 .. you could check your self. using the above calculator.
Swing High and Low ( 4hr )
How to Locate Support and Resistance
- Look for areas where prices have reversed in the past and are anticipated to reverse using Pivot Points or Bella's Swing Targets and Reversals (BSTR-Level).
(in the context of trading, let's take a real example of 1.28932 which is last month's high (08.03.2024) – what can we possibly say happened near the top?)
a. Traders were not interested in buying at higher prices. Demand had dried up and there was no longer any urgency to get long in this market.
b. The higher prices were attractive to those selling the market. Longs took profits on their position. New shorts entered the market. The increase in supply (selling) has absorbed any remaining demand.
Calculating Swing High ( Reversal Point using BSTR Level )
I will use an Example using BSTR Level. Market went long from 1.25992 on 01.03.2024 using the formula i provided
Step1: SQRT(125992) = 354.95
Step2: 354.95 + 4 = 358.95
Step3: 358.95 * 358.95 = 128848 or 1.28848
very close to 1.28932 , also Monthly Resistance 2 was also providing resistance.
Order Used : https://www.forexfactory.com/thread/post/14741421#post14741421
Numerology ( Financial Numerology )
In my research of developing a profitable intraday trading system , i came to know about a concept of Numerology which is used by some successful traders such as W.D Gann. What is Numerology? : it is relationship between a number and one or more coinciding events. It is also the study of the numerical value.. ( it is a very thorough and big subject , lots of books is written on the subject )
I will give example using my own Master Numbers , everyone should have their own master numbers there could be many ways to obtain them such as numbers coming from some event like Birth Date for e.g 14.04.1978 is my birth date ( yes i look 18 years but i am not 18 years ) calculated number is
14.04.1978 = 1+4 + 4 + 1+9+7+8 = 16
simplify 16 we get 1+6 = 7
7 becomes my Lucky number which i can use coming from Numerology Calculation
I have my own personal 3 Master numbers which i calculated for my self and they are personal to me and will be using it in forex , One of my Number is number 3
on Friday it worked good so lets see how i used it. ( please see the order above , posted on Friday)
Friday Date : 02.02.2024 = 2+2+8 = 12
Simplify 12 = 1+2 = 3 so the Date Number is 3
Bella's Master Number is 3 we have 100% match if you look at the Friday's order i posted the time is 14:41 that is my trading time ( see the order )
so at 14:41 on Friday i shorted GBPUSD cause the day matched with one of my Master Numbers which is 3 and made +90 Pips profit 4.5 R/R
If you are looking for books look into Financial Numerology or W.D Gann Books where he talks about Numerology, Some used trading numbers are
1,4,6,8,9 : Definitely it should be used with some trading system. ( you could read books and derive your own numbers )
Bella's Master Numbers = 3
Pivots
Understanding Markets ( Pivot Points)
Auction Process
The role of the marketplace is to facilitate trade between buyers and sellers. Price will auction higher and lower as it attempts to find an area where trade can easily be facilitated. If price opens too low, it will auction higher to find sellers, and if price is too high it will auction lower to find buyers.
Price continually moves higher and lower in search of the best value to both buyers and sellers. Buyers will enter the market when they feel price is below value, while sellers will enter the market when they believe price is above value.
So the No 1 Question now is what is the meaning of Value? İn context of Forex and Pivot Points.
Value = Pivot Point ( Calculation as Follows )
(Today's High + Today's Low + Today's Close ) / 3
Pivot Point : This is the focal point or the mean , which is derived from the collective market data from prior session's high,low, and close price.It is the strongest of the support and resistance numbers. Prices normally trade above or below this area before breaking in one direction.
In real life we use this concept on daily basis lets see a quick example using Shopping.
Meet Mr.Scot who is a fantastic shopper when it comes to food , clothes but throws all of his instinct when it comes to trading. Scot loves to eat Prawns, but he knows that this can be an expensive habit, so he must buy when the price of the prawns is below value.
Mr.Scot keenly observes the price of prawns regularly and knows that the average price per pound is about $10.99. As you can expect, when the price per pound drops to $6.99 he pounces on the offer and buys several pounds.
++ important considerations
Average Price = Pivot Point
Price Dropping to $6.99 is equals to finding Support at Daily Support1
On the other hand Mr.Scot opened his own Prawns Shop and is unsure of market value of his prawns and initially lists for $20.00 per KG. The market clearly sees this price as below value , as evidence by the boom of orders he receives. He sold 100 KG in his 1st Week and is extremely excited.. However, she decides to raise the price to $30 KG to see how the market will respond. He is delighted to see that his orders remained constant at 100 KG per week, meaning that buyers still feel that her prawns should be valued at current price.He feels the need to probe even higher to maximize the profit potential,therefore, he raises the price to $60.00 KG . This time, however, the market responded with fewer orders to buy and he only sold 25KG orders. He quickly reinstates the $30.00 price tag and feels confident that he has reached fair value of his prawns.
++important considerations
- We don't know the average price ( other companies are selling ) Pivot Point
- $60 KG is too expensive and represents either Daily Resistance 1 or 2
Conclusion: This explains why you will see price rally through resistance only to sell off sharply, or drop through support only to rally with conviction.
Advantages of Using Monthly Pivots
The higher time frame pivots inspire different types of market participants ( traders ) to enter and exit the market. Namely, Monthly pivots inspire swing traders and position traders participation.
Understanding this paradigm will help you understand which group of market participants are influencing price behavior, which allows you to gauge price conviction.
Concept of Smart Money: Smart money is the funds that are under control of institutional investors , central banks , fund market mavens , and other financial individuals and entities. They may not use Pivots but they could easily be located by using Monthly Pivots.
Monthly and Weekly Pivots
I previously mentioned "Smart Money" as the capital controlled by institutional investors, central banks, etc. Although we cannot know what system they use, we can locate them using Monthly Pivots. For instance, take my short from 09.04.2024 until 23.04.2024. I entered on 09.04 and also on 18.04. The 4-hour chart shows the smart money went short from Monthly Pivot 1.27078 till yesterday 1.22989.
Traders who will trade this move are known as “Position Traders” and trade off Monthly Pivots. If they use Weekly Pivots instead, they are called “Swing Traders” who keep trades for more than a few days and generally are traders that are placing themselves during some type of retracement with the main trend.
The weekly pivots can be used by swing traders who are looking for retracement trades in the direction of the main trend started by Position Traders. If you're interested in learning more about pivots, please research them on the internet.
Remember, Position Traders use Monthly Pivots, while Swing Traders use Weekly Pivots.
Projecting Today's High and Low using Pivots.
During trading, sometimes it is important to find out what could be Today's High and Today's Low of the Day. One Technique popularized by a Trader named Thomas Demark ( a well-known Technical Strategist ) is using previous days' highs and lows which directly correlate in some ways to pivot points. I will provide the calculations below which could be used with already qualified trading strategies as I believe these figures have little use when used stand-alone.
Friday's Data on Cable is as Follows. ( 22.03.2024 )
High = 1,26746 , Low = 1,25747 , Close = 1,25999
We also need to know if the close was < open or > open ( it is important to use the right calculation for given data ).
Using CLOSE < OPEN ( Friday's Data)
Get the Monday's High & Low ( 25.03.2024)
Steps as Follows.
1. X = 2 x Low = 2.51494
2. Add High = 3.7824
3. Add Close = 5.04239
4. Div X with 2 = 2.521195 (let's call it Y )
5. Subtract Y with High = 1.25373
Monday's Low = 1.25373
6. Subtract Y with Low = 1.26372
Monday's High = 1.26372
Expected High and Lows Projections for Monday date 25.03.2024 High: 1.26372 and Low: 1.25373
Now Suppose the Close of Yesterday > Open such as on the date 20.03.2024 the clac for next is as follows.
Using CLOSE > OPEN ( Wednesday's Data )
High = 1.27865 , Low = 1.26840 and Close = 1.27859
Steps as Follows.
- X = 2 x High = 2.5573
- Add Low = 3.8257
- Add Close = 5.10429
- Div X with 2 = 2.55214 (Let's call it Y )
- Subtract Y with High = 1.27349
Thursday's Low = 1,27349 - Subtract Y with Low = 1,28374
Thursday's High = 1.28374
Expected High and Lows Projections for Thursday date 21.03.2024 High: 1.28374 and Low: 1.27349
Projections
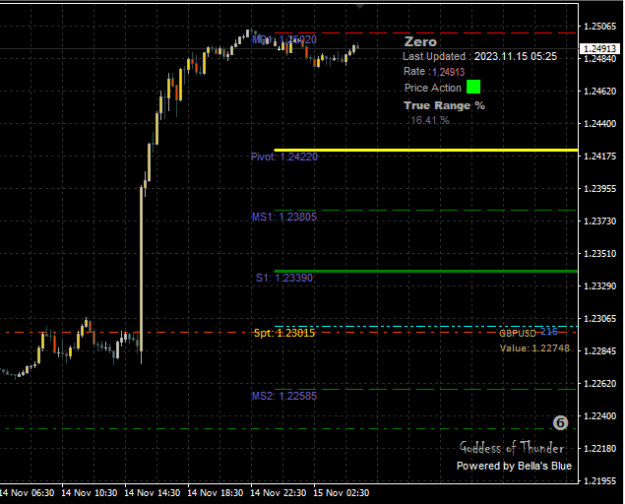
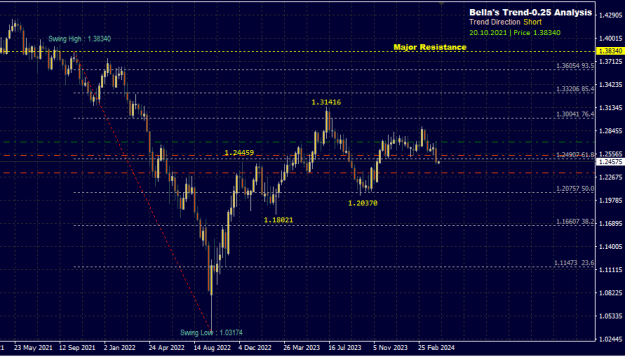
Bella's Trend-0.25
About Trend-0.25
The very first indicator that i created on GBPUSD, Special thing about this analysis is that it doesn't require time frame (Weekly or Monthly) but rather works on Currency. The advantage is that this shows one trend and one support or resistance on every time frame
Revising Weekly Charts using Bella's Trend-0.25.
Currently the analysis states that Resistance 1.38340 will not be taken out by market in near term and the low of 1.03174 placed on 25.09.2022 will be taken out in future.
As an Analyst my job is to use Technical Analysis and follow the market trends for which i later developed more indicators ( in finalizing state ). Since Trend-0.25 is the major trend of the currency it is vital to know it''s direction it is pointing and it's current resistance. Market can easy go as close as possible but eventually will fall down ( as per analysis )
Posting Rules on the Thread:
Only GBPUSD Charts and Trades are allowed to be posted on this thread. ( Note : Please don't Post any charts which are against my trades )
Bella ( Goddess of Thunder )