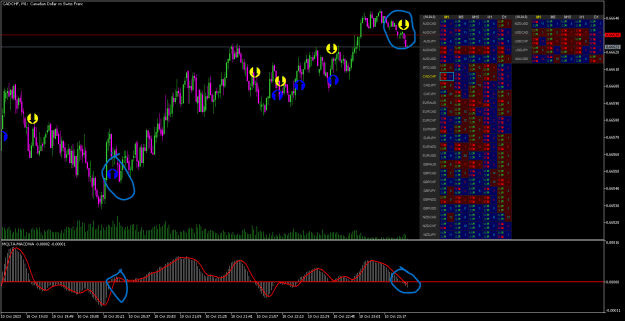
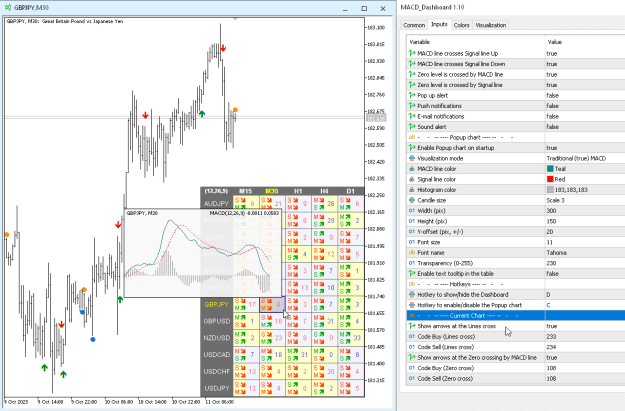
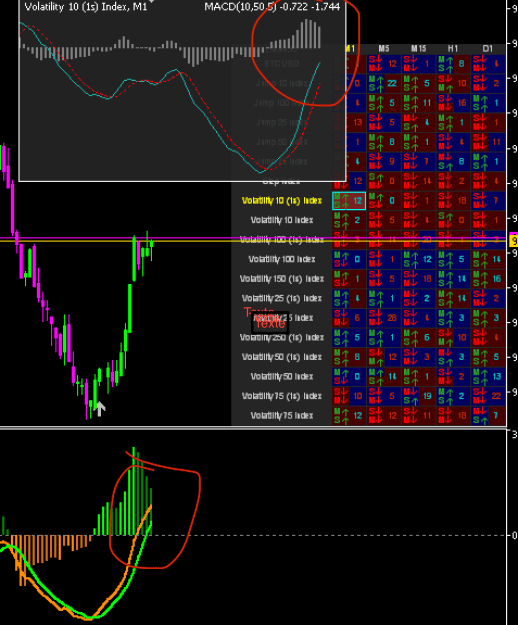
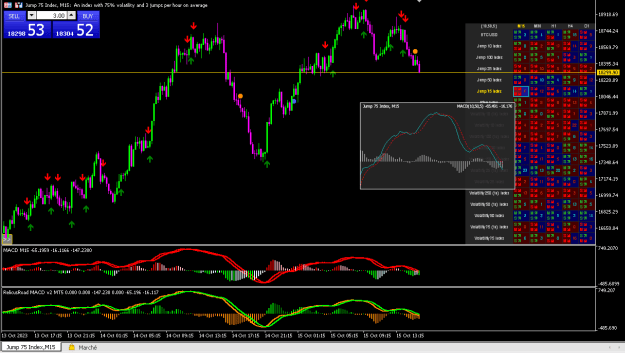
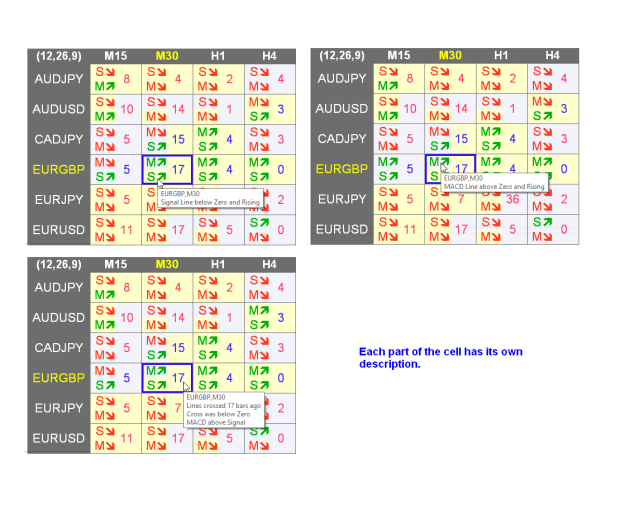
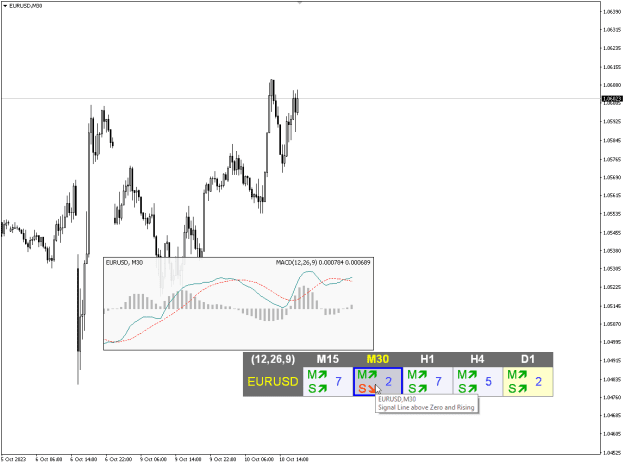
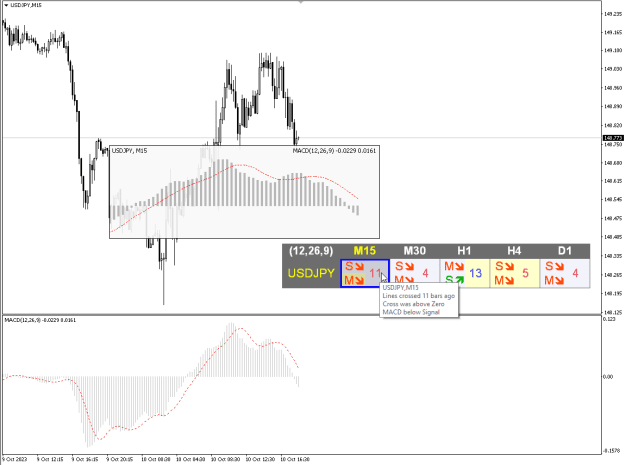
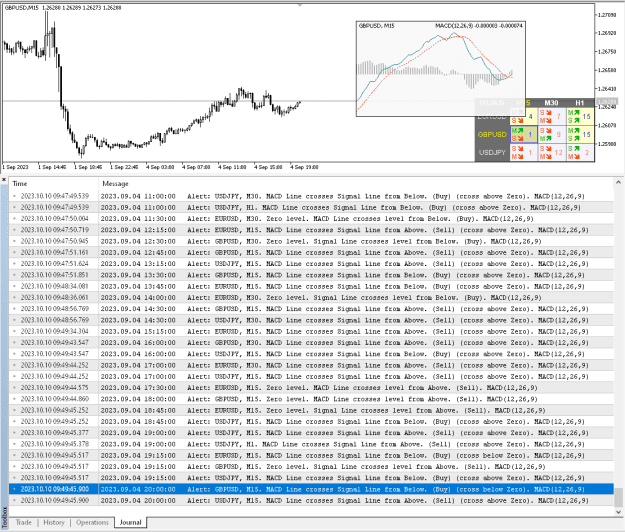
On the panel you can see the current state of the indicator — the direction of movement of the MACD lines, their intersection and a pop-up window with the indicator chart. In the parameters you can specify any desired pairs-symbols and timeframes. The scanner can also send notifications about lines crossing each other and about lines crossing the Zero level. By clicking on a cell, the given symbol and period opens.
You can also see the divergence (Regular and Hidden) between Price and MACD Line, and the divergence between Price and Histogram.
So, you can easily scan all pairs and symbols for all timeframes to find a cross of the MACD main and Signal line or Zero-level.
Hotkey to show/hide the Dashboard is "D" by default.
Hotkey to enable/disable the Popup chart is "C" by default.
Hotkeys to toggle Arrows on the chart '1' and '2' and '3'.
Demo version you can download directly from your MT4 (MT5), from the Market tab.
And you can try it in the strategy tester, in the visual mode.
Version for MT4 & MT5.


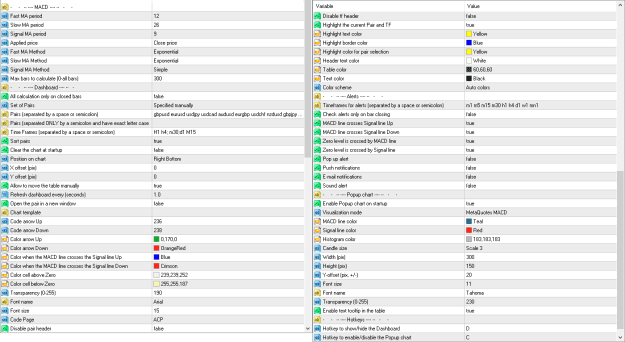
Parameters
MACD
- Fast MA period — period for Fast average calculation
- Slow MA period — period for Slow average calculation
- Signal MA period — period for their difference averaging
- Applied price — type of price that is used
- Fast MA Method — smoothing type for Fast average.
- Slow MA Method — smoothing type for Slow average
- Signal MA Method — smoothing type for Signal average. Methods can have one of the following values: SMA, EMA, SMMA, LWMA..
- Max bars to calculate (0-all bars)
- Divergence Histogram. Method for finding
- Divergence MACD Line. Method for finding
- Regular divergence
- Hidden divergence
- Both
- disable
- Divergence. Minimum bars to be visible in a cell
- Divergence. Depth
- Divergence. Deviation
- Divergence. Backstep
Dashboard
All calculation only on closed bars
Set of Pairs:
- Market Watch — pairs from the "Market Watch";
- Specified manually — pairs specified manually, in the parameters "Pairs".
- Current pair — show only the current pair.
Pairs (separated by a space or semicolon)
Pairs (separated ONLY by a semicolon and have exact letter case)
Time Frames (separated by a space or semicolon) (multi time frame)
Sort pairs
Clear the chart at startup
Position on chart
X offset (pix)
Y offset (pix)
Allow to move the table manually
Refresh dashboard every (seconds)
Open the pair in a new window
Chart template
Code arrow Up
Code arrow Down
Code Stop
Color arrow Up
Color arrow Down
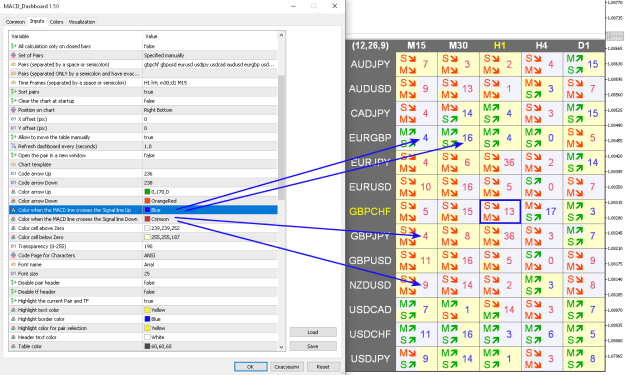
Color when the MACD line crosses the Signal line Up
Color when the MACD line crosses the Signal line Down
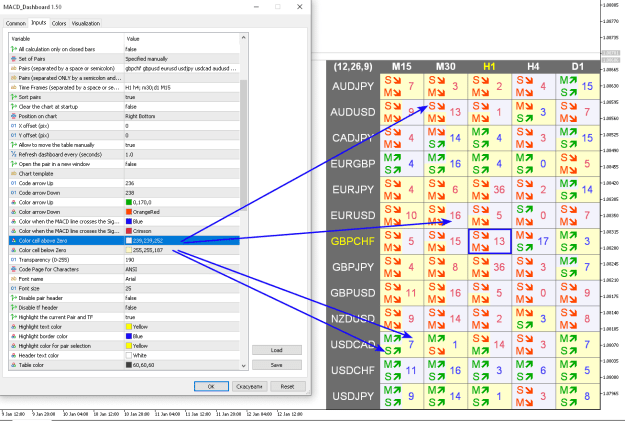
Color cell above Zero
Color cell below Zero
Transparency (0-255)
Font name
Font size
Disable pair header
Disable tf header
Highlight the current Pair and TF
Highlight text color
Highlight border color
Highlight color for pair selection
Header text color
Table color
Text color
Color scheme
Alerts
Timeframes for alerts (separated by a space or semicolon)
Check alerts only on bar closing
MACD line crosses Signal line Up
MACD line crosses Signal line Down
Zero level is crossed by MACD line
Zero level is crossed by Signal line
Regular divergence (Classic divergence)
Hidden divergence (Reverse divergence)
Pop up alert
Push notifications
E-mail notifications
Sound alert
Popup chart
Enable Popup chart on startup
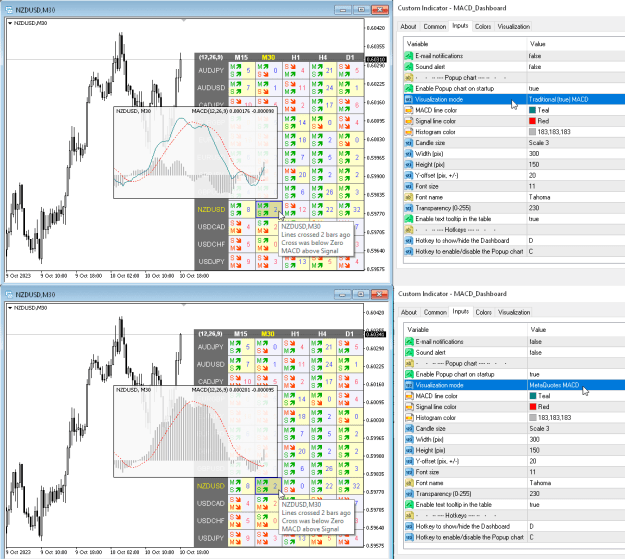
Visualization mode:
- Traditional (true) MACD
- MetaQuotes MACD
MACD line color
Signal line color
Histogram color
Candle size
Width (pix)
Height (pix)
Y-offset (pix, +/-)
Font size
Font name
Transparency (0-255)
Enable text tooltip in the table
Show Divergence Arrow
Show Divergence Line
Hotkeys
Hotkey to show/hide the Dashboard
Hotkey to enable/disable the Popup chart
Hotkey to toggle Arrows 'MACD crosses Signal line'
Hotkey to toggle Arrows 'MACD line crosses Zero level'
Hotkey to toggle 'Divergence'