Could anyone answer as to how the 89sma gives the trend of the market?
Is the trend defined by the being above/below the price, or is the trend defined by the slope of the 89sma?
At the moment many of the pairs are moving close to major MA's and it is difficult to know therefore whether your trade is actually a trend continuation trade or a counter trend trade
Ignored
When in doubt wait for price to show itself is what I do. Never guess what will happen or what could happen.
Could anyone answer as to how the 89sma gives the trend of the market?
Is the trend defined by the being above/below the price, or is the trend defined by the slope of the 89sma?
At the moment many of the pairs are moving close to major MA's and it is difficult to know therefore whether your trade is actually a trend continuation trade or a counter trend trade
Ignored
Hi Mr. ED,
What a great question! And Aftab's reply is worth more pips than you realize right now! When in doubt about direction, wait for the market to show itself to you before getting involved. However, I'm going to be "academic" for a minute (just to give us all something to think about) regarding the trend direction.
Our main objective is to make money in the market, and the easiest way is to follow the path of least resistance (i.e. trade with the trend), right? But, what is the trend and how do we as trader's determine which way the market is going? Isn't the trend the overall direction that the market is moving over a period of time? If that is how we define trend, then why do we argue with our longterm trendlines? If the lines are upwards (and price has not violated the upward support line), than price is in an uptrend (vice versa for downtrend). The real issues is that we, as traders, are afraid of missing out on pips and, therefore, we look to maximize our profits by identifying short-term trends within longterm trends (i.e. the correctional phases of the market ). We trade corrections both for profit and out of boredom. We feel we must always be doing something, and therefore, we trade up, down and sideways.
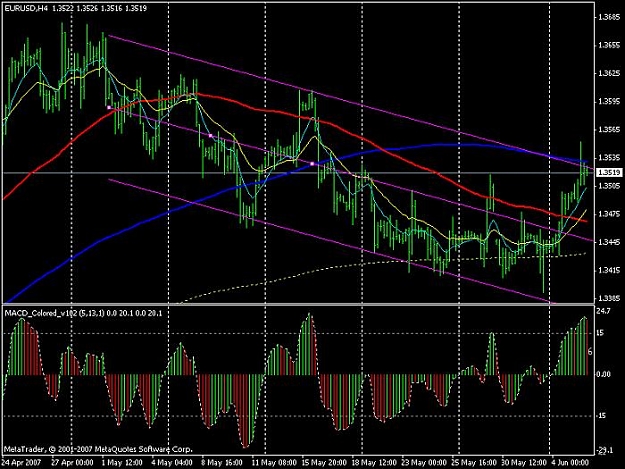
With that in mind, think about the lines on your chart. You most likely have your longterm trendlines which indicate the longterm directional bias of the market. Within those trendlines, you most likely have other lines which indicate short-term bias (like for cable, it is biased back upwards for the last week, which corresponds w/longterm trend)...The 4 hour system gives you another tool to help determine market bias. The 89 helps with short term market sentiment; if price is above the 89, mood is for buying...if price is below the 89 market sentiment has shifted to selling. Now, you must look at the lines on your chart and see if they are in harmony to market sentiment. The highest probability trades will unite market sentiment with the appropriate technical level on your chart (and sentiment is determined by watching S & R, thinking about price in relationship to the MA's and confirming short term direction w/MACD signal).
OK, the point I'm trying to make is this:
1. Overall Trend direction is determined by seeing the longterm price pattern up or down.
2. Conter trades are naturally against the longterm trend (i.e. any shorting of cable is really a contertrend trade b/c longterm trend is up).
In the 4 hour system, we define counter trades as going against our short term s & r lines, as well as going against short term sentiment as defined by the 89 (in relation to the other MA's ).
3. Anticipated price direction is determined by the MACD signal/direction.
4. Because we trade short term, we will naturally be looking for a method to identify short term trends (these are defined by our support and resistance lines as well as current directional moves in price, especially in moves away from the 89). When you see the price close to the MA's and bouncing around & between them, you are seeing a period of consolidation and market sentiment confusion. These periods are often difficult to trade because the markets are unsure if they are ranging, trending (even changing trend direction) or just plain choppy. These are the times when you either stay out of the market or trade based on your s & r lines (range plays).
With all this said, let me assure you the one thing traders everywhere struggle with is trend definition. How to define the trend to maximize trading profits (and that is why it becomes difficult ).
Happy trading all! Hope I didn't confuse people too much w/my ramblings...
That was very helpful. As a newbie, I would set trendlines and analyze the heck out of the chart. Then for some reason, I would look at the "big picture" and realize that that what I thought was an up trend was actually a very small portion of the over all down trend.
Great explanation mate thanks.We keep hearing "patience , patience, but when you only follow a couple of pairs on the 4 hour chart it is pretty boring action. We have heard lots of brilliant trading advise on this thread and we are all growing accordingly.Thanks again Phillip Pips and Co so much.
In Oz we are mostly trading the Asian session and can miss a lot of the MACD opportunity on the 4 hour chart. Phillip have you had any further thoughts on a daily system and what changes to the rules you would suggest.?
Is anyone else riding this BOZ on the CAD? Bounced off of 21EMA at the 0 macd mark like clockwork. hitting some turbulence at 1.0584, but may be in for another test of the 0550 mark.
Is anyone else riding this BOZ on the CAD? Bounced off of 21EMA at the 0 macd mark like clockwork. hitting some turbulence at 1.0584, but may be in for another test of the 0550 mark.
What a great question! And Aftab's reply is worth more pips than you realize right now! When in doubt about direction, wait for the market to show itself to you before getting involved. However, I'm going to be "academic" for a minute (just to give us all something to think about) regarding the trend direction.
Our main objective is to make money in the market, and the easiest way is to follow the path of least resistance (i.e. trade with the trend), right? But, what is the trend and how do we as trader's determine which way the market is going? Isn't the trend the overall direction that the market is moving over a period of time? If that is how we define trend, then why do we argue with our longterm trendlines? If the lines are upwards (and price has not violated the upward support line), than price is in an uptrend (vice versa for downtrend). The real issues is that we, as traders, are afraid of missing out on pips and, therefore, we look to maximize our profits by identifying short-term trends within longterm trends (i.e. the correctional phases of the market ). We trade corrections both for profit and out of boredom. We feel we must always be doing something, and therefore, we trade up, down and sideways.
With that in mind, think about the lines on your chart. You most likely have your longterm trendlines which indicate the longterm directional bias of the market. Within those trendlines, you most likely have other lines which indicate short-term bias (like for cable, it is biased back upwards for the last week, which corresponds w/longterm trend)...The 4 hour system gives you another tool to help determine market bias. The 89 helps with short term market sentiment; if price is above the 89, mood is for buying...if price is below the 89 market sentiment has shifted to selling. Now, you must look at the lines on your chart and see if they are in harmony to market sentiment. The highest probability trades will unite market sentiment with the appropriate technical level on your chart (and sentiment is determined by watching S & R, thinking about price in relationship to the MA's and confirming short term direction w/MACD signal).
OK, the point I'm trying to make is this:
1. Overall Trend direction is determined by seeing the longterm price pattern up or down.
2. Conter trades are naturally against the longterm trend (i.e. any shorting of cable is really a contertrend trade b/c longterm trend is up).
In the 4 hour system, we define counter trades as going against our short term s & r lines, as well as going against short term sentiment as defined by the 89 (in relation to the other MA's ).
3. Anticipated price direction is determined by the MACD signal/direction.
4. Because we trade short term, we will naturally be looking for a method to identify short term trends (these are defined by our support and resistance lines as well as current directional moves in price, especially in moves away from the 89). When you see the price close to the MA's and bouncing around & between them, you are seeing a period of consolidation and market sentiment confusion. These periods are often difficult to trade because the markets are unsure if they are ranging, trending (even changing trend direction) or just plain choppy. These are the times when you either stay out of the market or trade based on your s & r lines (range plays).
With all this said, let me assure you the one thing traders everywhere struggle with is trend definition. How to define the trend to maximize trading profits (and that is why it becomes difficult ).
Happy trading all! Hope I didn't confuse people too much w/my ramblings...
Pips
Ignored
Hi Pips
Thanks for your great reply. You have managed to clarify things very well. In essence the 89SMA gives us an idea about shorter term market sentiment and the trend lines tell us about the actual trend, if I understand correctly.
Transfering these thoughts to my charts I get the feeling that there is a lot of mixed sentiment (or emotion) in the markets at the moment and I probably will not be getting involved until the fog clears a bit.
Good to hear that others are sometimes as confused as I am.
I got in as well but that tail above the trendline stopped me out (1200 candle on my platform). Had I set the sl 6 pips higher I would still be in. I entered at 1.0594 with a sl of 1.0626. Macd gave a tc toward zero and back down. All was well and still would be if it had not been for that stupid tail .
Wow!!!! Phillip, your lessons keep getting better and better! You have such a gift when it comes to imparting your knowledge clearly!!!!! I really admire you!
You truly are special (here comes some more !!!!!!!!)
Thanks to all of you, and especially to you, Phillip. This is my first post in any venue on the internet, and I was much more comfortable just "listening in." However, I think this thread may actually turn my trading life around, and I needed to tell you all how much good I get out of reading your posts.
I put in a GTC order at 10:35 GMT for USDCAD to go short at 1.0623, which was the 21ma on the one hour chart. My four hour chart uses EDT, and I'm MDT, GMT-6, so I had to get to bed. I entered 1 mini-lot, and am very reluctant to take profit or move my stop down until I can get a better idea of the action. The move back up to the 21 got rejected again, so I'm in limbo until I can recognize a direction. The temptation to ride the Canadian train down is too tempting! -- Tony
Ignored
Hi Tony!
I agree w/ your post on the crazy CAD...but, I would like everyone to take a look at the daily chart...and think about the possibility of a retrace. Today's candle has an identical low to yesterday's (yesterday also showed the potential of a temp (?) bottom to the downmove. Not advocating anything one way or another, but the exact low is interesting, especially when yesterday's close was 1 pip lower than today's high (the two candles have the same range so far). Also, the white candle is an Bullish Engulfing to the small body candle previous, which may signal a reversal. Just something to keep in mind....here's a copy of the chart. Notice MACD turned too the other day...
I agree that Phillip gives you a great education in trading!
But, I believe that we should try to learn the basics the best we can from a technical perspective. Steve Nison's Japanese Candlestick charting Techniques is the foremost candlestick encyclopedia for trader's and is indispensible to me.
The James 16 thread was really helpful too (the free section).
Other than that, you should concentrate on what Phillip is teaching us re: rhythm and motion (it is better than anything I've got on my bookshelf!).
Lastly, I'm going to put a copy of the best book ever (this was a free e-book so there are lots of weird typos)...it gives you the origination of all the trading cliches and the mindset of a great trader (just don't go broke as many times as the narrator)....Rem. of a Stock Operator. It will explain basic trading paradigms. Very interesting to read, especially when you consider it was written in 1923 and see how little has changed in the market!
Enjoy reading!
Pips
PS Phillip, hope you don't mind me posting the e-book....I got it free off FF, so I don't think it is a violation (copyright is expired)...but, let me know if you think I should remove it from the thread.