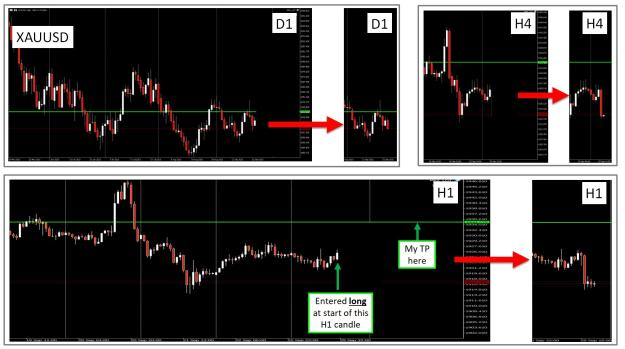
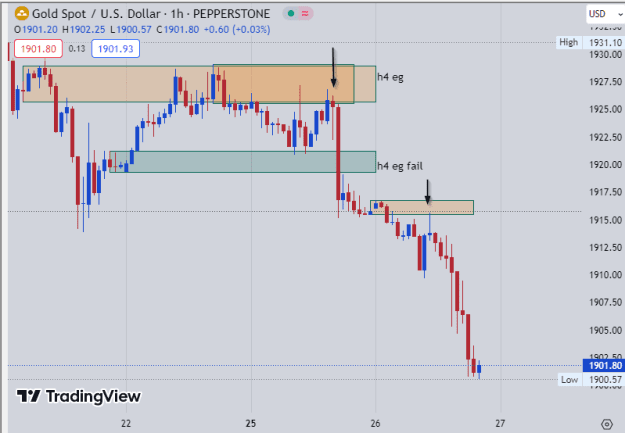
Dear all, I would like to ask for your opinion and analysis for this specific situation with GOLD today (XAUUSD, 25 Sep. 2023).
According to my analysis, it looked like gold was about to go up today and I entered long as per picture (H1 white candle) with a TP as per picture. Please do not ask me why this TP level... not important at this moment.
My questions are:
- Would you have “predicted”/”expected” gold to turn down (sharply) as it did, after the end of this H1 candle?
- If this was indeed your expectation, what do you base your expectation on? Could you please provide some details of your reasoning and way of analysis.
- Could some indicator(s) have helped you expect this down move? Or do you use any other analysis approach?
Thank you all for any insights you may have on this down move, quite unexpected for me.
Attached Image (click to enlarge)