I am trading currency now for more than 10 years. Today I will share with you the no 1 forex trading strategy. But before you peoceed to the strategy, you must have:
- excellent chart reading capacity
- you are a patient power house
- you love trading
Now, let's see if you know the basic price action.
Price wave
Price is a business done by institutions. Retail traders can only follow them. Like any other sustainable business, currency pair price start from a point then moves up, contracts then moves down and then contracts to decide where to move next. This is extremely important concept. This way price completes a wave. Once the 1st wave is complete, price does another wave then another and this goes on and on.
I found we need to identify only 2 types of wave and can ignore the rest to be extremely profitable:
- upward waves
- downward waves
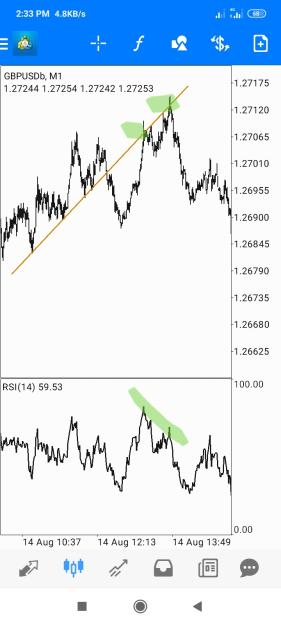
Now upward or downward waves can have minimum 2 to 5/6 waves where all waves in them can be similar in size or they can be big, medium, small, smaller smallest. One thing they have in common that is all of their bottoms can be touched down using a single line.
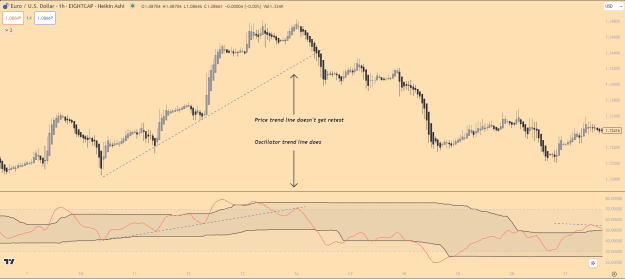
Wave confirmation
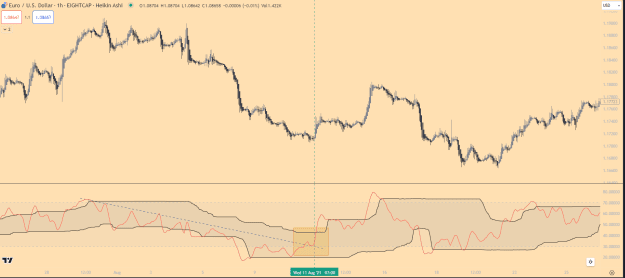
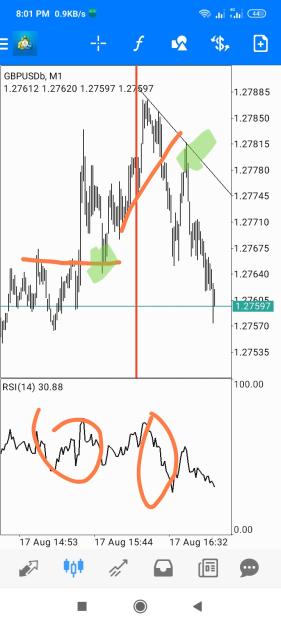
A single wave is confirmed and idenfiable using RSI line flow. If you find it hard to see the start and end of a wave, check rsi. We use rsi to see the complete formation of wave.
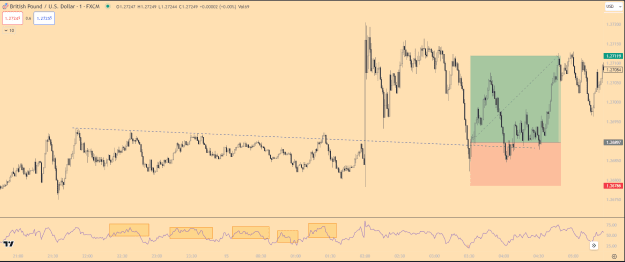
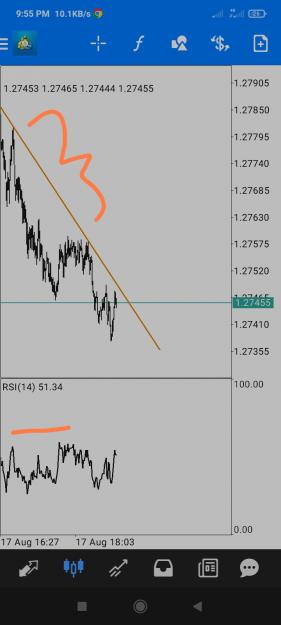
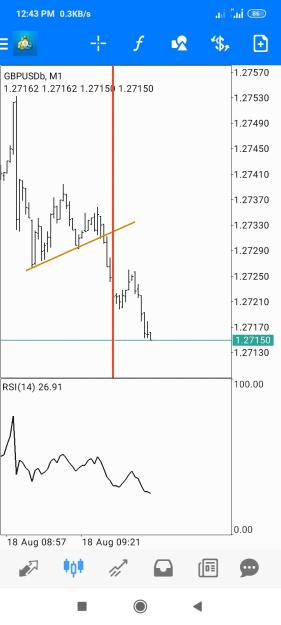
Channel Break
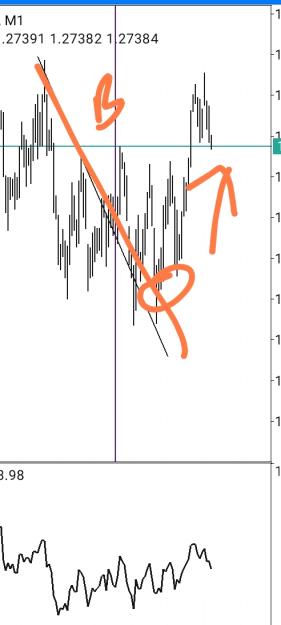
Once the bottom line is broke, we take it as our first signal. Break means:
- price strongly break below bottom line
- then price go 2/3 big candle away from bottom line
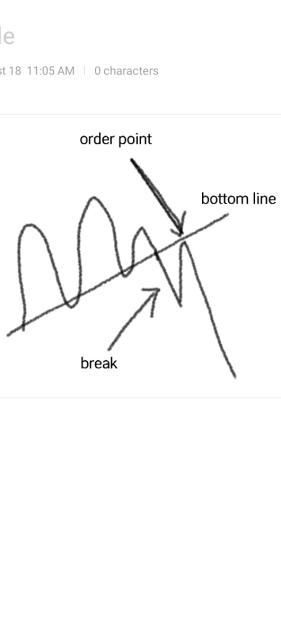
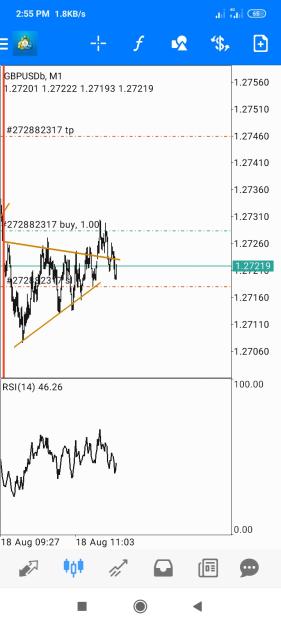
2nd signal
Price will go away and can go further. What must happen is:
- Institutions will get back to the point from where they broke away to balnce their accounts
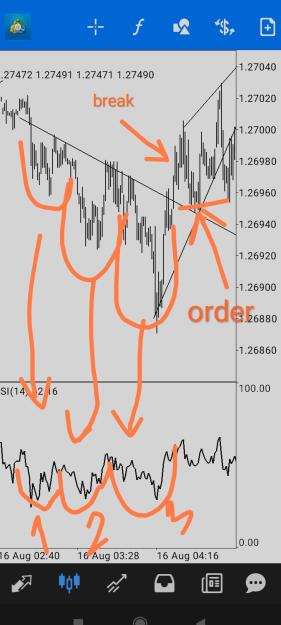
So you must wait until price gets back to that breaking point. Not have to be exact point but the more accurate the better. So the balance sheet is clean and now price can start a new wave. And this wave can lead to another channel, another bottom line, another Break and another opportunity.
Pure business
Close your eyes and Imagine that you watered the little plant coz it needed it. Then the afternoon you watered it again may be equal amount. Then as time progressed you watered it based on how much it needed it. Than once the plant has no demand and you are out of supply, you occupied yourself to gather more bottles of water.
So demand time increase price or water. Supply time decrease water or price.
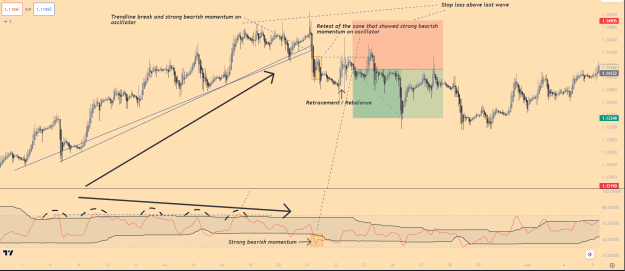
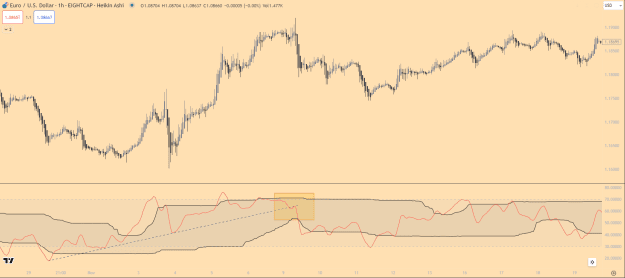
Rsi will show you the state of demand along with price in the chart. Don't use rsi for 70-30 overbought oversold. Rsi is purely there to show you how Institutions are forming waves. When breakout happens, rsi will show big spike. That's the new direction unless conditions are not met.
- Price on uptrend but rsi falling is a sign of breakout on the horizon
- as breaks happen, rsi spikes. But it will return back to normal
- completion of wave curve means completion of waves in rsi
- if you master it, you will be able to reduce noises and clearly see a wave forming in rsi
Business time
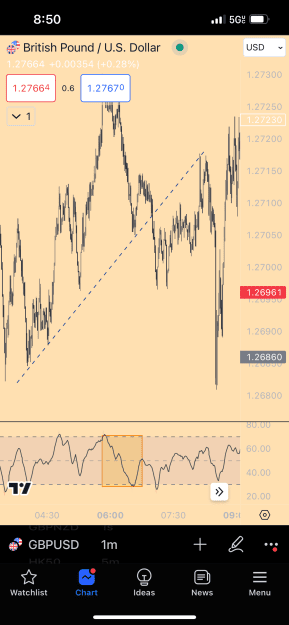
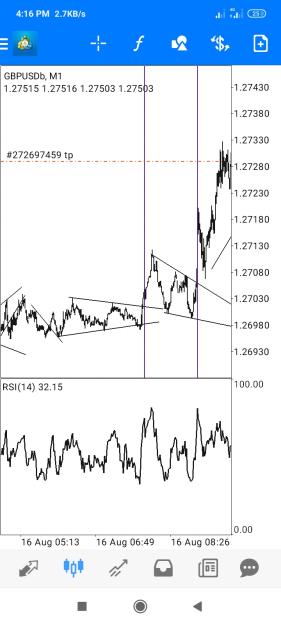
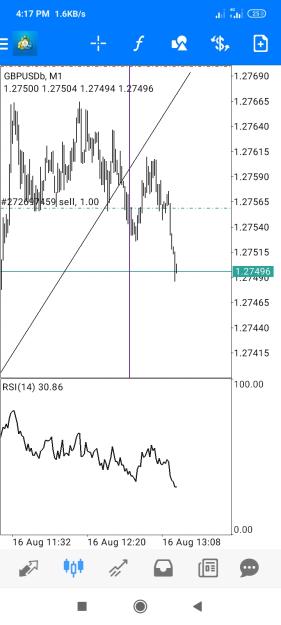
Once the price retrace to its origin, place sell order. It's your business so it's your risk appetite. That bottom line you take an order from is the area institutions clear their balance sheet and extremely likely to start an opposite trend than previous because:
- institutions may have balance sheet to clear which has its origin below somewhere is why price was rising last few hours. Opposite is true if recently price was in downtrend.
Pair to trade: GBPUSD
Timeframe: 1 minute
RSI: 14 period with no levels
Don't trade japanese candlestick. This is a price action method. We don't want red green candle to influence our decision but only do business according to price movement.
Recommend Broker: https://www.hfm.com/sv/en/?refid=376050Use
zero spread account.
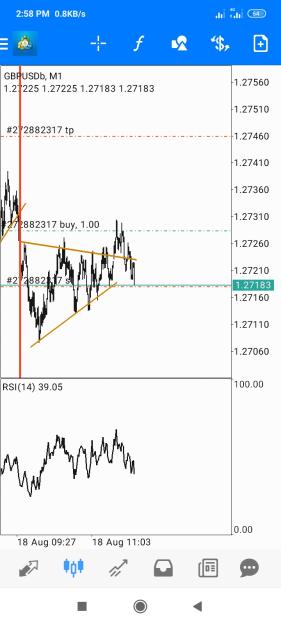
Take profit: closest contraction area if you're aggressive profit taker. Or you can trail bottoms.
Keep in mind, if last channel lasted longer than average, the next channel is likely to last longer than avg.
News time clearance
Business is only for institutions during news events. You don't want to participate. Don't keep open position. Keep off 5 min before news events and 30 minutes after Or until you see price cools down.
Don't burnout - Take care of yourself
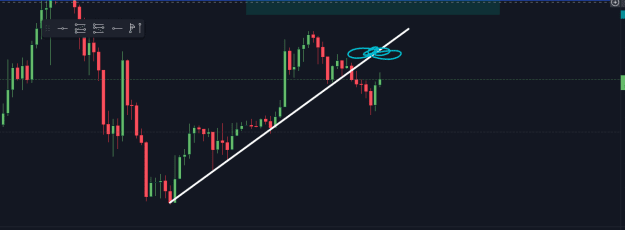
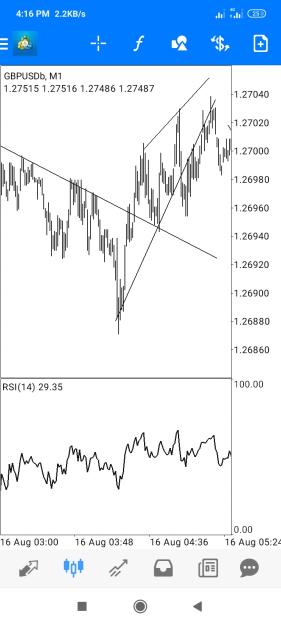
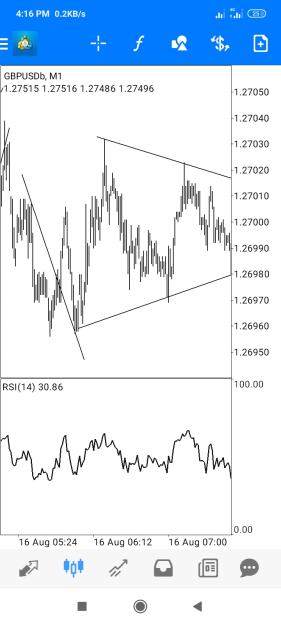
1. Waves create channel
2. Bottom line drawn connecting channel bottoms
3. Price breaks channel with force as the big spike confirms in rsi. New direction indication signal
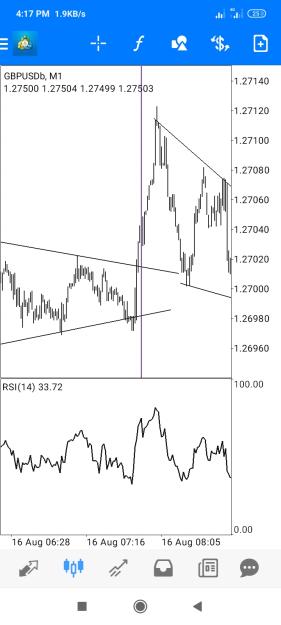
4. Price retrace back to the origin of the channel break point
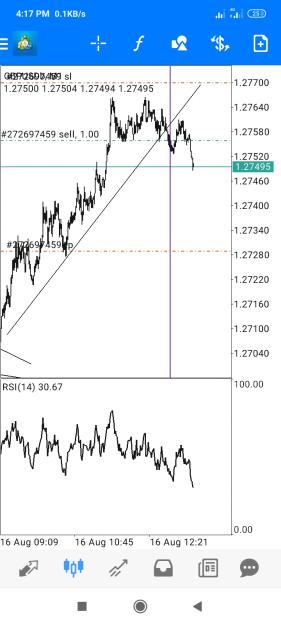
5. Place order
6. Stop loss must be kept away from channels last wave high/low..
7. Take profit aggressively or trail bottoms
It's your business
Trading is your business so chart is your 8-5 job. Coffee up!!
- excellent chart reading capacity
- you are a patient power house
- you love trading
Now, let's see if you know the basic price action.
Price wave
Price is a business done by institutions. Retail traders can only follow them. Like any other sustainable business, currency pair price start from a point then moves up, contracts then moves down and then contracts to decide where to move next. This is extremely important concept. This way price completes a wave. Once the 1st wave is complete, price does another wave then another and this goes on and on.
I found we need to identify only 2 types of wave and can ignore the rest to be extremely profitable:
- upward waves
- downward waves
Now upward or downward waves can have minimum 2 to 5/6 waves where all waves in them can be similar in size or they can be big, medium, small, smaller smallest. One thing they have in common that is all of their bottoms can be touched down using a single line.
Wave confirmation
A single wave is confirmed and idenfiable using RSI line flow. If you find it hard to see the start and end of a wave, check rsi. We use rsi to see the complete formation of wave.
Channel Break
Once the bottom line is broke, we take it as our first signal. Break means:
- price strongly break below bottom line
- then price go 2/3 big candle away from bottom line
2nd signal
Price will go away and can go further. What must happen is:
- Institutions will get back to the point from where they broke away to balnce their accounts
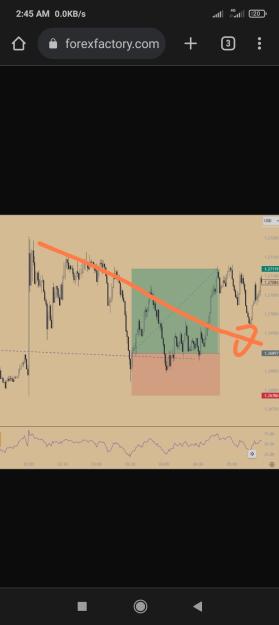
Attached Image (click to enlarge)
So you must wait until price gets back to that breaking point. Not have to be exact point but the more accurate the better. So the balance sheet is clean and now price can start a new wave. And this wave can lead to another channel, another bottom line, another Break and another opportunity.
Pure business
Close your eyes and Imagine that you watered the little plant coz it needed it. Then the afternoon you watered it again may be equal amount. Then as time progressed you watered it based on how much it needed it. Than once the plant has no demand and you are out of supply, you occupied yourself to gather more bottles of water.
So demand time increase price or water. Supply time decrease water or price.
Rsi will show you the state of demand along with price in the chart. Don't use rsi for 70-30 overbought oversold. Rsi is purely there to show you how Institutions are forming waves. When breakout happens, rsi will show big spike. That's the new direction unless conditions are not met.
- Price on uptrend but rsi falling is a sign of breakout on the horizon
- as breaks happen, rsi spikes. But it will return back to normal
- completion of wave curve means completion of waves in rsi
- if you master it, you will be able to reduce noises and clearly see a wave forming in rsi
Business time
Once the price retrace to its origin, place sell order. It's your business so it's your risk appetite. That bottom line you take an order from is the area institutions clear their balance sheet and extremely likely to start an opposite trend than previous because:
- institutions may have balance sheet to clear which has its origin below somewhere is why price was rising last few hours. Opposite is true if recently price was in downtrend.
Pair to trade: GBPUSD
Timeframe: 1 minute
RSI: 14 period with no levels
Don't trade japanese candlestick. This is a price action method. We don't want red green candle to influence our decision but only do business according to price movement.
Recommend Broker: https://www.hfm.com/sv/en/?refid=376050Use
zero spread account.
Take profit: closest contraction area if you're aggressive profit taker. Or you can trail bottoms.
Keep in mind, if last channel lasted longer than average, the next channel is likely to last longer than avg.
News time clearance
Business is only for institutions during news events. You don't want to participate. Don't keep open position. Keep off 5 min before news events and 30 minutes after Or until you see price cools down.
Don't burnout - Take care of yourself
1. Waves create channel
2. Bottom line drawn connecting channel bottoms
3. Price breaks channel with force as the big spike confirms in rsi. New direction indication signal
4. Price retrace back to the origin of the channel break point
5. Place order
6. Stop loss must be kept away from channels last wave high/low..
7. Take profit aggressively or trail bottoms
It's your business
Trading is your business so chart is your 8-5 job. Coffee up!!
Attached Image (click to enlarge)
Attached Image (click to enlarge)
Attached Image (click to enlarge)
Attached Image (click to enlarge)
Attached Image (click to enlarge)
Attached Image (click to enlarge)
Attached Image (click to enlarge)

Protect your capital