• Home
  • Forums
  • Trades
  • News
  • Calendar
  • Market
  • Brokers
  • Login
  • Join
  • User/Email: Password:
  • 1:50am
Menu
  • Forums
  • Trades
  • News
  • Calendar
  • Market
  • Brokers
  • Login
  • Join
  • 1:50am
Sister Sites
  • Metals Mine
  • Energy EXCH
  • Crypto Craft

Options

Bookmark Thread

First Page First Unread Last Page Last Post

Print Thread

Similar Threads

Multi Stoch - expanding upon 'Spud's Stochastic Thread Theory' 254 replies

Time Frame Vs Personality, Which to choose as Main Time Frame? Who Are You? 10 replies

Time frame and Enter/Exit, Time frame and S/L, T/P relationships. 91 replies

Question on Lower Time Frame Indicators Vs. Longer Time Frame 7 replies

  • Trading Systems
  • /
  • Reply to Thread
  • Subscribe
  • 6
Attachments: Spud's Multi Time Frame Strategy Guide
Exit Attachments
Tags: Spud's Multi Time Frame Strategy Guide
Cancel

Spud's Multi Time Frame Strategy Guide

  • Post #1
  • Quote
  • First Post: Edited 8:55am May 30, 2007 8:28am | Edited 8:55am
  •  Spudfyre
  • Joined Jan 2007 | Status: MTF Stochastics and Volume/Price | 1,133 Posts
A compilation of my systems and/or strategy guide has been requested by a few people. So I decided to put everything in a somewhat organized manner here in one place as a reference tool for traders.

I ask that you resist placing any comments here for the first few days so that I can compile that strategies together as the first few posts. If you need to make a comment about the guides, please PM me or leave a comment on my journal or in my Fib strategy.

PLEASE DON'T POST COMMENTS HERE (yet).

I will produce a PDF of this guide when I have finished compiling it here. The PDF Guide will have more details about the strategies. I have made some minor adjustments to some strategies for ease of use for the entire system. If you would like the PDF guide, I am going to request that you PM me and send me your e-mail so I can send you the guide. The PDF is free...my systems are always free.

This guide will start from the basics. I am not including huge amounts of details here, those can be founf in my journal, the FIb trading system or from the PDF guide.

I hope it helps your trading endeavors.

--Spud
  • Post #2
  • Quote
  • May 30, 2007 8:46am May 30, 2007 8:46am
  •  Spudfyre
  • Joined Jan 2007 | Status: MTF Stochastics and Volume/Price | 1,133 Posts
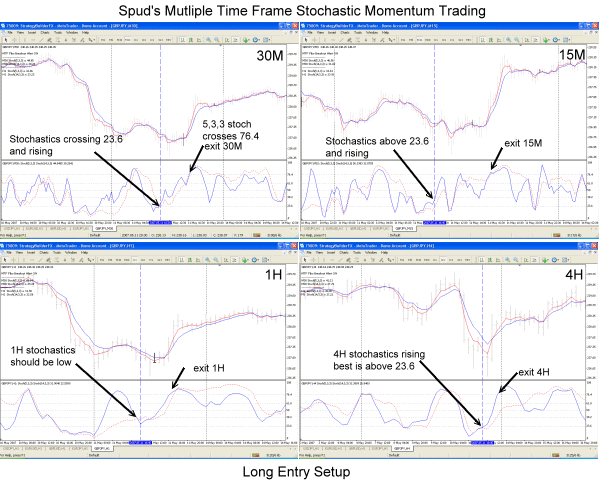
Multiple Time Frame Stochastic Momentum Trading

This is the basics of stochastic trading with multiple time frames. This system alone will provide a very high win percentage with low pips. This system is best traded aiming for 7-20 pips and locking in profit when it comes.

Time Frames:
15M and 30M are the triggers
1H is support and extending the exit
4H is to gauge trend direction

Stochastics: 5,3,3 and 14,3,3 (high/low, simple) overlay in one window, only view %K lines. Levels are 23.6, 38.2, 50, 61.8 and 76.4.

Long Entry Example:

15M and 30M should have crossed and be rising above 23.6
1H should be low in the stochastic range (at least below 50)
4H should be rising and should be above 23.6

Exits:

Exit on the 15M, 30M or 1H time frame when the 5,3,3 stochastic hits 76.4 or higher. The longer the time frame for an exit the lower the winning percentage but higher the pip gains. On average, stochastics on any time frame will rise after crossing 23.6 and hit 76.4 about 75-85% of the time. Using the support of multiple time frames will allow us to raise this success by 5-15% if we recognize the way lower time frames cycle more within the longer time frame move in one direction.

Notes:

We want at least 3 time frames moving in the up direction. It is better if the 4H is rising with the 15/30M but the 15/30/1H rising works too so long as the 4H is low in the stochastics, even if falling. It is also good if the 1H or 4H or both are above 76.4 as this tends to pull the 15/30M up.
Attached Image
 
 
  • Post #3
  • Quote
  • May 30, 2007 9:34am May 30, 2007 9:34am
  •  Spudfyre
  • Joined Jan 2007 | Status: MTF Stochastics and Volume/Price | 1,133 Posts
Escalator to Pips

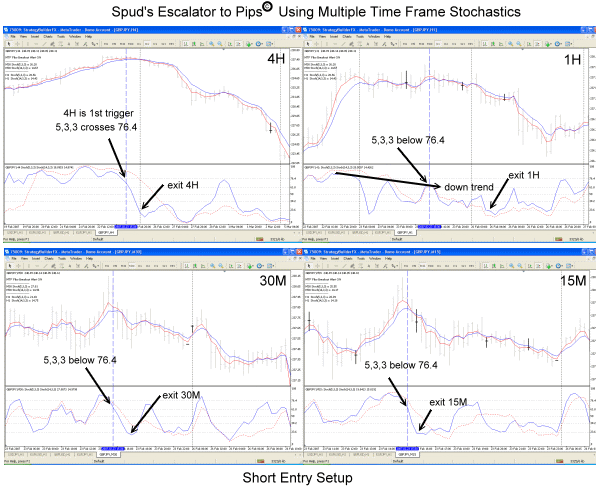
Escalator to Pips is an extension of the momentum strategy. The entry requires a little more agreement of the stochastics over multiple time frames and the result is a progression of fairly confident exits.

Time Frames:
4H is the trigger and marks entry possibility
15M, 30M and 1H all must confirm with the 4H.

Stochastics: 5,3,3 (high/low, simple), only view %K lines. Levels are 23.6, 38.2, 50, 61.8 and 76.4. Note: you can use the 14,3,3 for visual cues and even adjust this method to trade by the 14,3,3 stochastic rather than the 5,3,3. I recommend only use one or the other stochastic for the trigger.

Short Entry Example:

4H stochastic must be above 76.4 and move down across the 76.4 to start looking for an entry.
15M, 30M and 1H time frame stochastics should be crossing or below 76.4 as per same rules as 4H time frame stochastic. It is always nice if all 4 time frames have just crossed but not necessary.

Exits:

Exit on the 15M, 30M or 1H time frame when the 5,3,3 stochastic hits 23.6 or lower. The longer the time frame for an exit the lower the winning percentage but higher the pip gains.

Notes:

Generally we usually see a progression of exits from 15M, 30M, 1H and 4H. When the 15M stochastic hits the 23.6 and we decide to chase the 30M stochastic it is best to "get off" the 15M time frame and forget it, otherwise it may make us hesitate as it cycles up and down while waiting for the 30M. This is why we call this Escalator to Pips as each time frame hits it's exit point, we get off that time frame's escalator and ride the next time frame escalator.
Attached Image
 
 
  • Post #4
  • Quote
  • May 30, 2007 10:11am May 30, 2007 10:11am
  •  Spudfyre
  • Joined Jan 2007 | Status: MTF Stochastics and Volume/Price | 1,133 Posts
The 80/20 Rule

If we are going to learn anything about stochastics, it should be the 80/20 rule. This rule covers initiating any Forex trade when stochastics are between the 20 percent and 80 percent levels.

There is a statistical fact that the stochastics on any single time frame will cycle from 80 percent to 20 percent levels and from 20 percent to 80 percent levels. Even with just a single time frame this can be a good indicator of price movement. However, used in conjunction with multiple time frames it is probably the most reliable price direction indicator at our disposal in Forex trading.

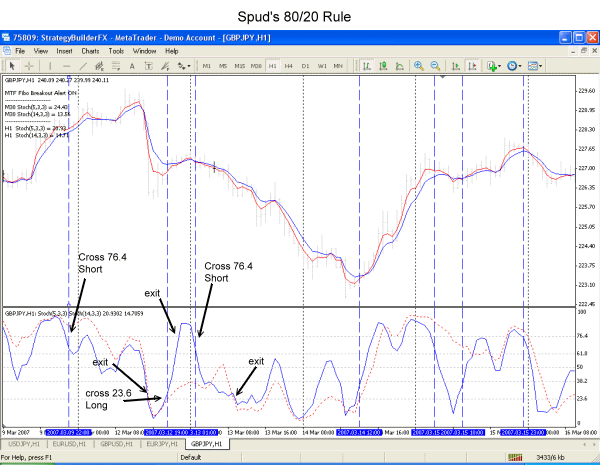
The rule itself is simple. Stochastics (either just the 5,3,3 %K or the 14,3,3 %K or both) must move from above the 76.4 level ("80") and cross to be below the 76.4 level to initiate a short trade. For a long trade, the stochastic(s) must move from below the 23.6 level ("20") and cross above the 23.6 level to initiate a long trade. The more time frames that do this or have done this in tandem, the stronger probability our trade will be a success.

Below is a 1H time frame chart. The 5,3,3 stochastics crosses either 76.4 or 23.6 12 times. . 7 of those times the stochastic moves from 76.4 to 23.6 or from 23.6 to 76.4. About a 58% success rate.
However, if we use the 30M and 1H time frames and use the 1H as our trigger and confirm the same cross with the 30M, we now still have 12 times where the 1H stochastic crossed 76.4 or 23.6, but our 30M time frame only confirmed 9 entries, so that we now have 7 out of 9 successes or a 78% success rate with 2 time frames. In other words a simple 20% increase in win% just buy adding one time frame.

This is why multiple time frames and stochastics work. Learn the 80/20 rule and use multiple time frames with any system we choose and we will increase our win% rate.

Note: Each successive time frame adds to the success rate when they agree. The largest increase in success comes with adding one time frame to another for confirmation, usually a 15-20% success gain, adding a third time frame adds another 5-7% success and a fourth about 3-5%. After that, the added success gains are small and usually filter out too many trades. So, at the very least use 2 time frames in all your trading!
Attached Image
 
 
  • Post #5
  • Quote
  • May 30, 2007 12:02pm May 30, 2007 12:02pm
  •  Spudfyre
  • Joined Jan 2007 | Status: MTF Stochastics and Volume/Price | 1,133 Posts
Scalping

If not to make pips then to at least have fun! Actually, don't let the word scalp fool you because more pips can be made in a day this way than waiting for a long trade.

Scalping means we are going to try and grab 0-5 pips a trade above our spread. So this only works with low spread pairs of 3 pip spread or less.

Time Frames:
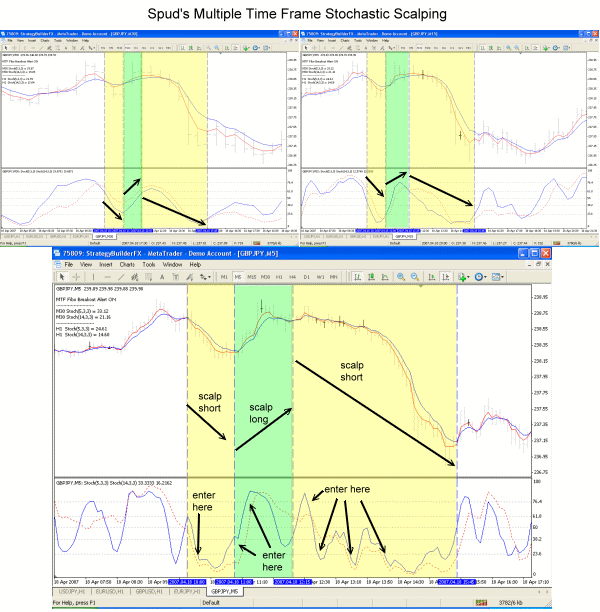
30M and 15M determine direction of scalp trade.
5M determines entry and exit
Market is deemed to be "moving against us" if the 15M and 30M stochastics turn against our 5M trade.

Stochastics: 5,3,3 and/or 14,3,3. I prefer just using the 5,3,3 as it responds faster. However, I like to see the 5,3,3 and 14,3,3 moving together closely (tight) rather than spread apart on the 5M when entering.

Example:

We look at the 30M and 15M stochastic chart for direction. The stochastics of both time frames MUST be both moving in the same direction to enter a trade in that direction.

Once we know the direction we wait for the 5 minute stochastic to either meet the 80/20 rule or just entering above 76.4 (long) or just entering below (23.6). Now this may seem contradictory but it is not. Most of the long pip action will happen from 76.4 to 100 and most of the short pip action will happen from 23.6 to 0. Having said that, the 80/20 rule also provides reliable price action movement.

Sometimes you may get multiple entry signals, other times only one entry signal on the 5M chart during the 15M/30M moves.

Exits:

Exit when you have 5 pip profit max! Don't get greedy it will burn you....actually it will sizzle you. If you have 2 pips and you don't like the movement of the stochastics, grab 2 pips. The idea here is to grab a pip and run. Grabbing 5 is nice but 1 is good too.

Stops:

Keep stops tight. 10-15 pips max+spread. That may sound like a lot when chasing 5 pips, but winning percentage is on our side. Too tight a stop will drastically lower the win percentage. Typically these trades like to bounce for 10 to 12 pip draw downs, so if we are stopping it is a good idea to monitor what happens to the trade after a stop to adjust our future stop levels.

Notes:
There is no need to trade every entry point. As a scalping system there may be 100 trades a day on a single pair, so pick the spots that look the best and go for those. I usually only trade about 10-20 scalps a day and usually average around 30-50 pips profit just from that. We will lose a few trades but we'll win more.
Attached Image
 
 
  • Post #6
  • Quote
  • May 31, 2007 7:57am May 31, 2007 7:57am
  •  Spudfyre
  • Joined Jan 2007 | Status: MTF Stochastics and Volume/Price | 1,133 Posts
Spud's Multiple Time Frame Stochastic Fibonacci Break Out Method (FIBO)

Just call it FIBO for short. The FIBO method is really the cumulative effort of multiple time frame trading with stochastics. All the previous rules and systems apply in FIBO but now we deal with what happens when the stochastics break into the 76.4 to 100 range and the 0 to 26 range.

The FIBO method is an extremely powerful way to make pips but there are rules to follow and this method requires patience as most trades will last over a 2 day range.

The Hi/Lo From Yesterday Breakout

For some phenomenal reason price breaks out when it crosses the high of the previous day, the low of the previous day. Price will also bounce off this previous day high or low.

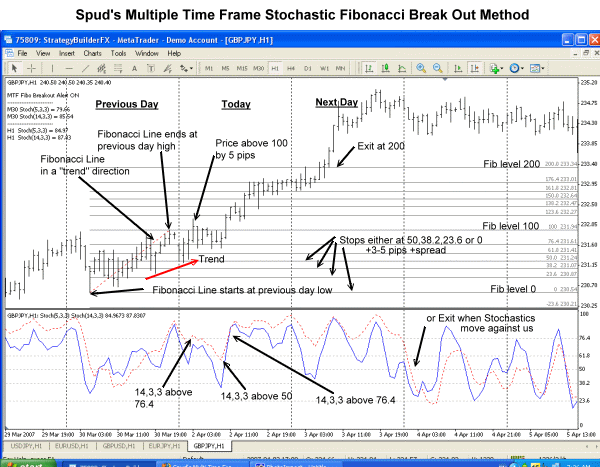
As such if we draw a Fibonacci line from the low of the previous day to the high of the previous day we can create a percentage scale for the price moves of today. Yesterday is between 0:00 GMT and 24:00 GMT.

The Fibonacci Levels

When using the Fibonacci indicator we want to create 3 "0-100%" scales. The first is from the low to the high of yesterday and is between 0 to 100.
The second is for above yesterdays high and is between 100 to 200.
The third is below yesterday's low and is from 0 to -100.

The Fibonacci levels are:

-100, -76.4, -61.8, -50, -38.2, -23.6, 0, 23.6, 38.2, 50, 61.8, 76.4, 100, 123.6, 138.2, 150, 161.8, 176.4, 200
Attached Image
 
 
  • Post #7
  • Quote
  • May 31, 2007 8:15am May 31, 2007 8:15am
  •  Spudfyre
  • Joined Jan 2007 | Status: MTF Stochastics and Volume/Price | 1,133 Posts
Spud's Multiple Time Frame Stochastic Fibonacci Break Out Method (FIBO) continued

The fundamental rules about FIBO is that we are looking for a price move on the Fibonacci scale from:
0 to 100
100 to 200
0 to -100
100 to 0

These moves are extremely common and the only thing we need to figure out as traders is if the price will break or bounce when it hits 100 or 0. So when price reaches 100 it only has 2 directions to go; up or down from 100 to 200 or 100 to 0. The same when the price hits 0; 0 to 100 or 0 to -100.

The Indicators for Direction

Stochastics over multiple time frames is our key indicator. Primarily we are using the 4H and 1H charts with the 30M or 15M chart for timing.

We also can utilize the direction of the Fibonacci line from low to high. If the Fibonacci line is with the low first and the high following, this is called a "trending" Fibonacci line and the price will tend to follow this trend the next day when price hits 100 or 0. If the Fibonacci line is with the low following the high from the previous day, this is called a "retrace" Fibonacci line and price is likely to bounce or retrace in the opposite direction of the price movement when price hots 100 or 0.
Attached Image
 
 
  • Post #8
  • Quote
  • May 31, 2007 8:46am May 31, 2007 8:46am
  •  Spudfyre
  • Joined Jan 2007 | Status: MTF Stochastics and Volume/Price | 1,133 Posts
Spud's Multiple Time Frame Stochastic Fibonacci Break Out Method (FIBO) continued

Entry For a Long Breakout (Use the 1H chart)

1. The price must cross the Fibonacci 100 level (at any time) and should cross it by at least 5 pips headed up.
2. The Fibonacci line should be in a trending direction
3. Price should be trending upwards....this may be a short trend or long trend but overall the recent move by price should be headed up....if there is a long down direction and the upward move is a reverse to this downward trend than it is not wise to trade the upward breakout.
4. The 14,3,3 Stochastics should be near or above the 76.4 level. Best if the 4H is in agreement too but give the 4H a little more room. It is always better if the 1H and 4H stochastics are above 76.4.
5. Set the stop at the 50,38.2,23.6 or 0 level with 3-5 pips extra and add your spread in. I recommend the 23.6 level or 38.1 level but it depends on the pips involved. Let the stochastics guide you.

The Trade
There is a very high percentage that price will move from 0 to 100. So much so we should simply set our Take Profit at 200 (less spread), give the trade stop room and let it ride. I strongly rcommend this approach.
The alternative is to watch the stochastics and let them be your guide using any of the MTF stochastic methods. This is a more conservative approach.

Stops and Draw Downs
Keep in mind price will rarely move in a straight line and will have moves against us. Even a stop at the 0 level is a 1:1 risk reward ratio but it is rare for the price to move beyond the 38.2 level against us. The number of successes will far out number the failures so my suggestion is to run with the trade to 200.
Don't be too greedy! If we are up 100 pips and stochastics move against us, grab the 100 pips.

Stochastics
The 14,3,3 stochastic should be our main guide in following the the trade and at entry.

Exit
Always exit a long breakout at the 200 level. If the upward trend continues we will have a new entry the next day. We can use the 14,3,3 stochastic as our signal as an optional choice.

NOTE: When setting the Fibonacci line and the trade continues in the next day, we still use these original Fibonacci levels until we reach our target. Alternatively, we can use the new levels to change our exit on the new days Fibonacci levels if price has dipped. However, each trade should follow it's original Fib level target until it is hit or stops out.
 
 
  • Post #9
  • Quote
  • May 31, 2007 8:58am May 31, 2007 8:58am
  •  Spudfyre
  • Joined Jan 2007 | Status: MTF Stochastics and Volume/Price | 1,133 Posts
Spud's Multiple Time Frame Stochastic Fibonacci Break Out Method (FIBO) continued

Entry For a Short Bounce (Use the 1H chart)

Bounces are not as common as breakouts and usually they will offer pips in both directions (up or down).

1. The price must cross the Fibonacci 100 level (at any time) and should cross it by at least 5 pips headed up.
2. The Fibonacci line should be in a retrace direction
3. Price should be trending upwards....this may be a short trend or long trend but overall the recent move by price should be headed up....if there is a long down direction and the upward move is a reverse to this downward trend than it is not wise to trade the upward breakout.
4. The 14,3,3 Stochastics should be near or above the 76.4 level or near or below the 23.6 level. We want the stochastics to look like they may follow the 80/20 rule or be in an oversold position.
5. Set the stop at the 150,161.8,176.4 or 200 level with 3-5 pips extra and add your spread in. I recommend the 161.8 level or 138.2 level but it depends on the pips involved. Let the stochastics guide you.

The Trade
Odds are price will move either way and this trade relies heavily on our MTF stochastic rules. Our ability to read the stochastics for a bounce move will lead us to more success. Bounces can be tricky so ignoring the opportunity can be an option. Don't be afraid to exit early on a bounce if you have some pips in hand.

Exit
Target is the 0 level. However use the 14,3,3 stochastic as our signal as an optional choice.

SHORT BREAKOUTS and LONG BOUNCES AT THE 0 LEVEL
These are set up reverse to the long entries.

NOTE: I strongly suggest hunting for only 1 trade entry in a day with the FIBO method. Price may cross and recross the 100 or 0 levels after an entry but we stick to our original trade.
 
 
  • Post #10
  • Quote
  • Aug 31, 2014 2:53am Aug 31, 2014 2:53am
  •  arvindeept
  • | Joined Jan 2013 | Status: luckytrader | 212 Posts
good article
 
 
  • Post #11
  • Quote
  • Last Post: Sep 12, 2015 3:55pm Sep 12, 2015 3:55pm
  •  candyman752
  • Joined Mar 2013 | Status: Member | 1,773 Posts
affirmative
 
 
  • Trading Systems
  • /
  • Spud's Multi Time Frame Strategy Guide
  • Reply to Thread
0 traders viewing now
Top of Page
  • Facebook
  • Twitter
About FF
  • Mission
  • Products
  • User Guide
  • Media Kit
  • Blog
  • Contact
FF Products
  • Forums
  • Trades
  • Calendar
  • News
  • Market
  • Brokers
  • Trade Explorer
FF Website
  • Homepage
  • Search
  • Members
  • Report a Bug
Follow FF
  • Facebook
  • Twitter

FF Sister Sites:

  • Metals Mine
  • Energy EXCH
  • Crypto Craft

Forex Factory® is a brand of Fair Economy, Inc.

Terms of Service / ©2023