I bought off a high volume down bar like a sucker. 1. Initial Sign of Strength - High volume down bar into fresh new ground. Fresh ground being nothing to the left of the body of the bar for the previous 5 bars (wicks are ok!) 2. Higher time frame confirmation - H1 chart, next bar closes up showing price is reacting to the initial sign of strength. 3. Change of trend - Two consecutive up bars with the second bar making a higher high and higher low. 4. Price reacting positively to strength - Hidden test with the next bar closing...
Ignored
Great example.
I have a question. When trading vsa everyone mentions to look at 2 bar combo. The first bar being the high volume bar and the second the confirmation.
The confirmation bar needs to be up? ( in your example the big volume bar is down)
I have seen many times that the following bar is down but not able to close below. So not able to make progress and then it moves up. So is not exactly big volume bar down and then up. Which takes me to the next question
Does the high/ low of the big volume bar needs to be pierced to for it to be confirmed?
And las question
Following your example would you trade before the bar after the big volume bar ends on the high timeframe. Let say that you have your big volume bar and then inside the following hour you have a low volume test or a no supply. Will you trade it or you wait for the confirmation. Basically the next 1 hour candle needs to finish before you enter?
{quote} When trading vsa everyone mentions to look at 2 bar combo. The first bar being the high volume bar and the second the confirmation. The confirmation bar needs to be up? ( in your example the big volume bar is down) I have seen many times that the following bar is down but not able to close below.
Ignored
If I'm understanding your question correctly, you're thinking that I'm looking for the next bar to be up on the M15 chart after the initial sign of strength, which I'm not. The only bar that I look to close up is on the higher time frame.
{quote} Does the high/ low of the big volume bar needs to be pierced to for it to be confirmed?
Ignored
I don't specifically look for the high/low to be pierced. I have two confirmations for the initial sign of strength. First is the trend change, two consecutive up bars with the second bar making a higher high and higher low. The second confirmation being the next bar closes up on a higher time frame. Once those are met then I start looking to see if price is responding to strength or ignoring weakness.
{quote} Following your example would you trade before the bar after the big volume bar ends on the high timeframe. Let say that you have your big volume bar and then inside the following hour you have a low volume test or a no supply. Will you trade it or you wait for the confirmation. Basically the next 1 hour candle needs to finish before you enter? Thanks for your help in advance
Ignored
No I absolutely would not trade before the H1 confirmation bar closes. That higher time frame confirmation keeps me out of a lot of bad trades, especially on trending days.
I do miss out on trades by waiting for that H1 confirmation, but not as many as you would think. Maybe 2-3 trades a month take off with out me because I'm waiting on confirmation. More than half of the trades I take end up being early to where I have to sit on the trade while price grinds sideways for hours and hours.
I apologize about the hindsight chart, but there are some good points on this chart. This weekend family was in town so I was up all day Sunday and couldn't stay up Sunday night to trade.
1. Initial Sign of Weakness - No demand Up thrust, I would've liked that ND volume to be below the MA, but you can't be too picky about the volume in the first few hours of the day.
2. Trend Change - Two consecutive down bars with the second bar making a lower low and lower high.
3. Higher Time Frame Confirmation - H1 chart, next bar closing down confirming the weakness from the No demand up thrust.
4. Price ignoring strength/responding to weakness - At this point I'm looking for price to show me its weak, we have a problem at Bar 4 though, price is responding to strength. Easiest way to deal with this is to wait for price to close below the low of the strength bar. Which Bar 5 gives you a heads up that price is still weak, but its safest to wait for the low of Bar 4 to be taken out before looking for an entry.
What I'm trying to show is price turning on low volume, it isn't always going to be on climatic volume. Also notice how long price grinds sideways, from start to finish its 14 hours before price drops. Stop and think a minute, yesterday price was in distribution for 14 hours and dropped something like 50 pips. Does a 50 pip drop make sense for a 14 hour distribution? Hopefully a light went off, on what you can expect to happen today.
To follow up with USDCAD, we're seeing strength come in which is countermanding to the weakness from yesterday's high. There isn't much on an edge now.
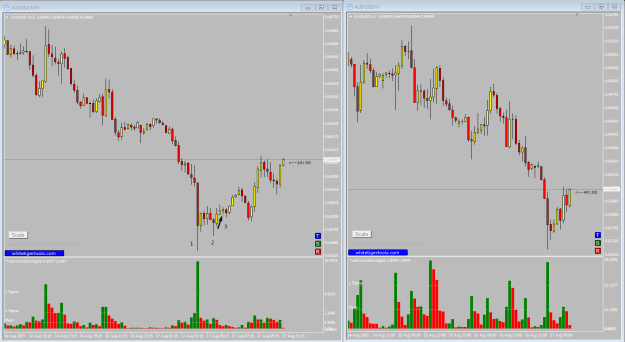
Initial sign of strength - no supply into fresh new ground, nothing to left of the body for the past 5 bars. (I didn't number it, the bar on the crosshairs)
1. Trend change - Two consecutive up bars with the second bar making a higher high and higher low.
2. Price reacting to strength - Weird looking hidden test.
3. Higher Time frame confirmation - Next bar closing up confirming the M15 no supply bar.
I didn't mark it, but on M15 chart that last completed bar is a widespread up bar on increasing volume which is very bullish. After that initial sign of strength you want to see decreasing volume on down bars and increasing volume on up bars. But like I said with yesterday's weakness and strength coming in now, I'm not really interested in putting my money at risk, better setups will come for sure.
{quote} If I'm understanding your question correctly, you're thinking that I'm looking for the next bar to be up on the M15 chart after the initial sign of strength, which I'm not. The only bar that I look to close up is on the higher time frame. {quote} I don't specifically look for the high/low to be pierced. I have two confirmations for the initial sign of strength. First is the trend change, two consecutive up bars with the second bar making a higher high and higher low. The second confirmation being the next bar closes up on a higher time frame....
I'm very bored so I thought I through some charts out into FF. Been a really slow week for me, even though there has a been a ton of high impact news. Not sure if my slow week during a busy week is a good thing or not.
Monday was the only trade I've taken soo far.
USDCAD short.
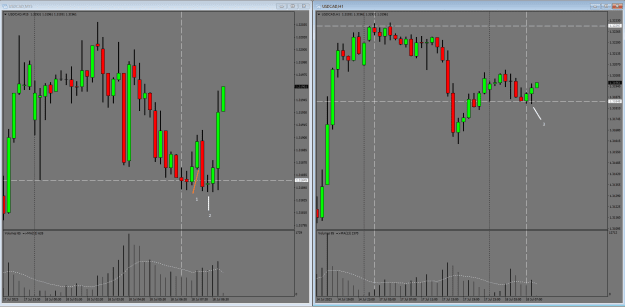
1. Initial SoW - No demand or failed test depending on how you look at it. Fresh new ground nothing to the left of the body for the previous 5 bars.
2. Trend Change - 2 consecutive down bars with the 2nd bar making a lower high and lower low. I didn't market it, but H1 chart the next bar is down confirming the initial SoW.
3. High volume up bar - After you've seen that initial SoW you want to see low volume up bars and high volume down bars. This high volume up bar is bullish, but you don't want to buy the pair with the initial SoW behind you.
4. Bar 4 takes out the low of the high volume up bar, when that happens I'll start looking to short it.
Attached Image (click to enlarge)
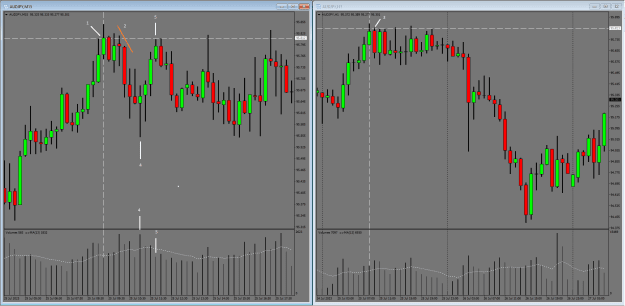
Soo Tuesday there was a short on AUDJPY, I didn't take it because of AUD CPI news early Wednesday. If you trade with a stop loss those high impact AUD news events like CPI/Interest rates are almost always violent and will take out any stops. I tend to not trade AUD the day before big news.
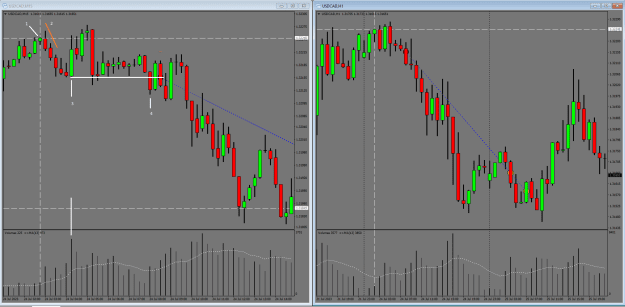
1. Initial SoW - No buying pressure bar into fresh new ground. Nothing to the left of the body of the bar for the previous 5 bars (wicks are ok!)
2. Trend Change - 2 consecutive down bars with the 2nd bar making a LH/LL.
3. Higher Time Frame Confirmation - Next H1 bar closes down confirming the initial weakness on M15.
4. Sign of Strength - Shakeout type bar with price reacting positively to it. Ideally you want to wait for price to close below the low of this bar.
5. Sign of Weakness - Obvious no demand into the close of the initial sign of weakness, the safest thing is still to wait for price to close below the low of bar 4.. But if you follow PA along the close of Bar 1 you can see multiple failed attempts to break higher. I could see myself shorting the 2nd up thrust after bar 3.
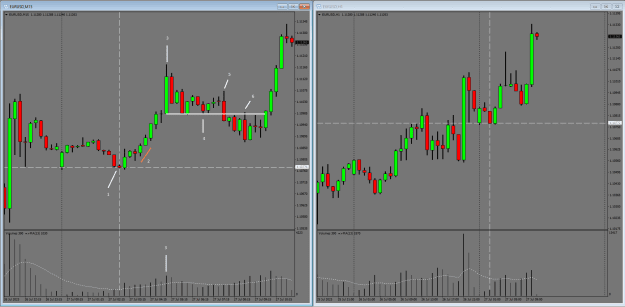
So today is euro rate announcement, so since I trade with a stop loss obviously not going to trade euro.. But EU is the only pair I see anything remotely close to a setup.
1. Initial Sign of Strength - classic no supply into fresh new ground.
2. Trend Change - 2 consecutive up bars with the 2nd bar making a HH/HL.
3. High volume selling - Ok by my definition this bar is weakness, climatic up bar into fresh new ground so this is a countermanding signal for me causing me to completely void the trade. But from a VSA perspective you can say its an absorption bar pushing up and through the PA from the US session yesterday.
4. Test - If you look at bar 3 as absorption bar then you look for a test either at the mid point or low on bar 3. Bar 4 is a no supply into the low, but PA gets ugly after that.
5. Bullish trap - with the wick above the previous bar and solidly pushes below the low of bar 3, PA looks super bearish.
6. This bar looks weak as well, if you had bought the test on bar 4 I would think you would have a hard time holding on the trade.
So here is my take away, I wouldn't want to be in a long trade based on an the absorption bar. Yes price did eventually push up and would've been a nice trade but for 3 hours the PA would've had you under pressure and second guessing yourself. I would rather wait for something easier to trade like the USDCAD short on Monday.
a bit quiet here, vsa is one of the best strategy out there, but nobody is interested to take a look ... lol, good so no problem we need a crowd!!! ... lol
ok here my last GBPUSD trade, NFP day i took a position around london time after analysing the movement i really didnt care about the news outcome for VSA trader the direction is clear where it will go even before the news ... just need risk management.
Hey guys, I have created a ruleset for myself on what trades I should take, for high probability setups. Any recommendations on things I should adjust? Or just criticisms/thoughts in general? (1 minute timeframe)
Trading The Lack Of Volume At a Volume Zone: Tests / No Demands Trading Volume At Volume: Springs / Upthrusts
Springs / Tests above HB of YHVZ or 1m HVZ No Demands / Upthrusts below HB of YHVZ or 1m HVZ
Other Viable Levels: 5m Spring, 5m Upthrust
Must be far outside range of 1m HVZ, can be outside of YHVZ range as well but not mandatory.
If Upthrust is at or under HB of YHVZ, look for shorts.
If Spring is at or above HB of YHVZ, look for longs.
Use 1m VSA signals mentioned above for your entries at these levels (tests, no demands, springs, upthrusts)
For every trade taken, you must ensure you are trading in the direction of the trend of the 5m chart. (If no clear trend and just consolidation, still trade but proceed with more caution)
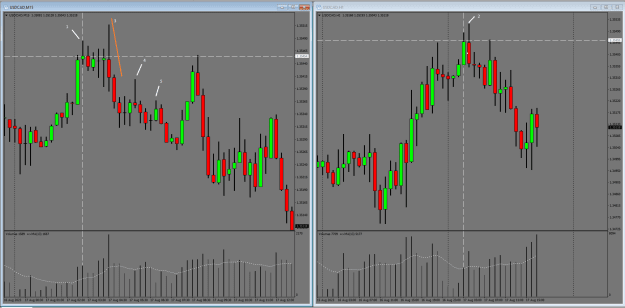
You can see the strength there at Bar 1, but its not really into fresh new ground. If you look the left of the body of Bar 1 there is PA within the past few bars. But with a 35 pip range so far today doesn't seem like it would've been worth the effort.
Bar 1: Massive weakness, the volume on that up bar is the highest volume in Asia, plus that volume is climatic volume for the Asian session.
Bar 2: Wide spread down bar after weakness but on low volume. After you've seen that initial weakness on Bar 1, you expect to see decreasing volume on up bars and increasing volume on down bars.. Look at Bar 1 and as well as the down bars previous to bar 1, they're all on decreasing volume its like the lower price went after the prior selling the less interested the market became.
Orange Line: change of trend, 2 consecutive up bars with the 2nd bar making a higher high and higher low.
Bar 4: price reacting to strength with price kinda sorta reacting to it, I'd like to see either of the next 2 bars after bar 4 to close above the high which neither did, but they both were up bars so I guess that's something.
Bar 5: I was on the fence about saying that price was reacting to strength on bar 4, but bar 5 is a violent shakeout with the next bar up. With this bar I was very confident price was now bullish just because of this shakeout and how the next bar closed above the shake out.
I didn't mark it, but H1 chart next bar closes up after the initial sign of strength on bar 2. With how price is currently behaving it seems there is more strength on EA, I closed it during the Asia session with price dipping below the low of that high volume up thrust. I can't complain with my profit, but woulda been nice to pull 200 pips off this trade.
Oh something I want to point out is notice on the up move, see how a lot of the up bars having increasing volume? Not all of them but a lot of them do, you want to see decreasing volume on down bars and increasing volume on up bars after that initial sign of strength.. Thats such an important lesson I think.
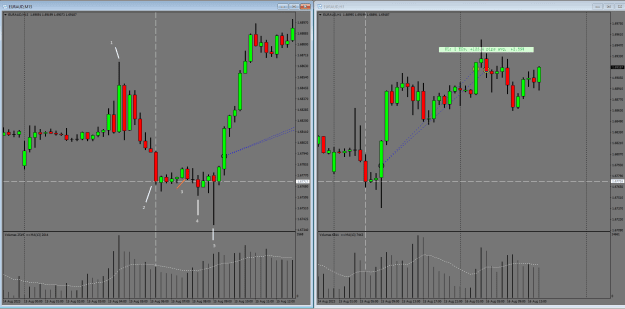
Not my time of day, but I hope Anotan took it. 1. Strength coming on down bar; climatic volume. 2. Low volume test 3. 2 consecutive candles making HH Guess Anotan you entered after those 2 candles? {image}
Ignored
I came here to write a long ass post on trade management..
But lets talk about this setup.
I wouldn't have taken the AU setup, the next H1 after your initial SoS at Bar 1 closes down which isn't confirming the strength on Bar 1. You can make the argument that the next H1 bar looks like a bullish test and I wouldn't recommend going down the rabbit hole of analyzing the reaction bar. Just a simple is up down or level.
But you do have a setup on UCAD.
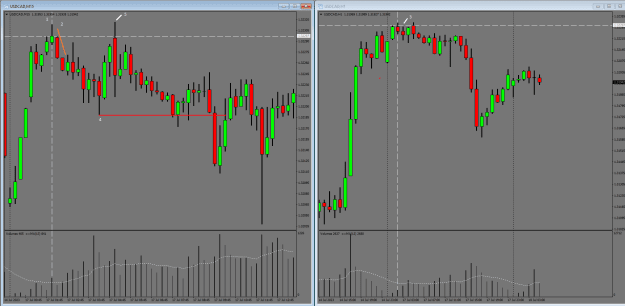
Bar 1: Initial Sign of Weakness - Up thrust into fresh new ground
Bar 2 H1 confirmation - Next bar after the initial sign of weakness closes down confirming the weakness.
Bar 3 - Trend change - Two consecutive down bars with the 2nd bar making a lower high and lower low.
Bar 4 - Price reacting to weakness / price ignoring strength - Another up thrust with the next bar closing below the up thrust.
Bar 5 - Entry - Depending on the trader you are if you like to take head fakes or just waiting for tradition VSA setup you could entered as price popped above the little bullish test on the bar before Bar 5 or you could've waited till price broke below Bar 5.
I didn't trade today, if I'm being honest most weeks I see 1 or 2 solid trades and take about 2-3 partial losses and I'll see 1 or 2 full losses per month. So with that I'm moving over to where once I hit a win in a week to take the rest of the week off. With yesterday I was aiming for a 4% win but exited early. But 4 weeks times 3-4% a week is 12-16% per month. How can you be mad at trading less?
I've decided to write this in multiple posts and a lot of this is based on experience and I may not communicate that experience well. If you have questions ask me I will answer them as straight forward as I can.
So lets start with this, if you're trying to follow what I'm doing.. I'm looking for the main move, I'm not interested in scalping, this is more of swing trading. That is a whole mindset you have to put yourself into. You have to be ok with price coming back on you. Personally I don't want to chase 1:1 setups all month long, especially when you can easily get 3 or 4 trades a month that are 3:1 or higher.
When you go into a trade you have to be prepared for draw down, don't get me wrong you will get more than your fair share of trades that go your way immediately but that isn't always this case. If you look at USDCAD on the previous post, you would've dealt with 10-15 pips of drawn down.
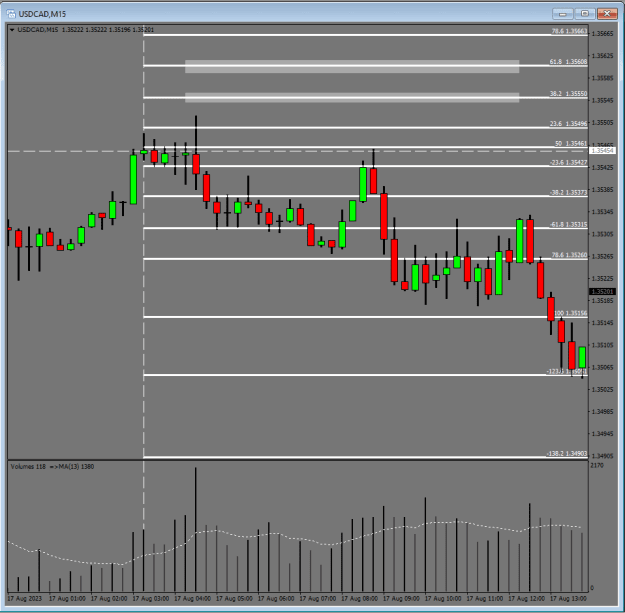
When you initially set your stop loss it has to be beyond the close of your initial sign of strength/weakness. In this case of USDCAD it has to be beyond 1.3545. Theres a few things I like to do, if you can look to the left and see previous PA in the prior days then I would look for trapped buyers. Look for a shakeout type bar above that close of 1.3545.. Find that bar that suckered in buyers then dropped price on them. Forex loves to do that, and rarely returns to let those trapped buyers out of their bad position. Use that to your advantage.
But on USDCAD we don't have any PA from the previous days. So I'd us my expansion zones I talked about here. These aren't my go to for finding stops, but what else can you do in this situation? Using the zone on the M15 you can set your stop a level or two above the highest point here to give this trade some room to breath while professionals continue to distribute.
{quote} I came here to write a long ass post on trade management.. But lets talk about this setup. I wouldn't have taken the AU setup, the next H1 after your initial SoS at Bar 1 closes down which isn't confirming the strength on Bar 1. You can make the argument that the next H1 bar looks like a bullish test and I wouldn't recommend going down the rabbit hole ofe}
Ignored
Anotan how is it going
Do you trade for a living. You trade part time or is just a hobby?
A couple of posts ago I said that I take 2-3 partial losses per week.
As trades move your way you need to protect yourself. From a business perspective partial profits seem counter intuitive, especially if you start taking partials close to your entry point. At first it seems like all you're doing is reducing the amount of profit that you can potentially make meanwhile keeping the same risk when a trade completely fails and hits your stop loss when you get things wrong.
Here's the deal, when you have a 500 dollar account you don't give a shit about capital preservation, all you care about is making money. Change that account to 100,000 account and suddenly capital preservation means a whole lot more. Develop those habits sooner rather than later.
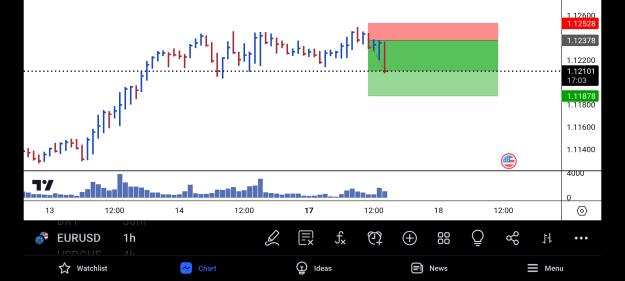
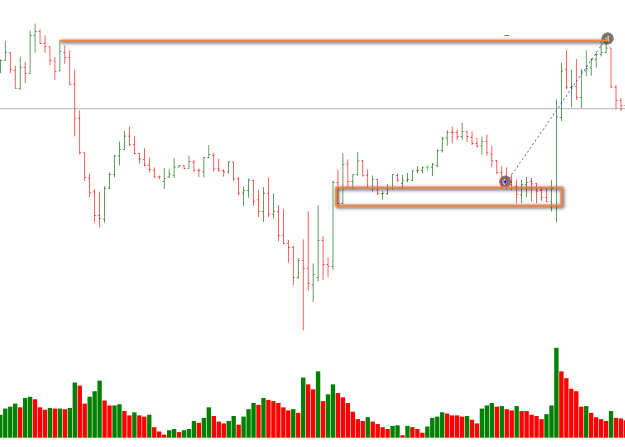
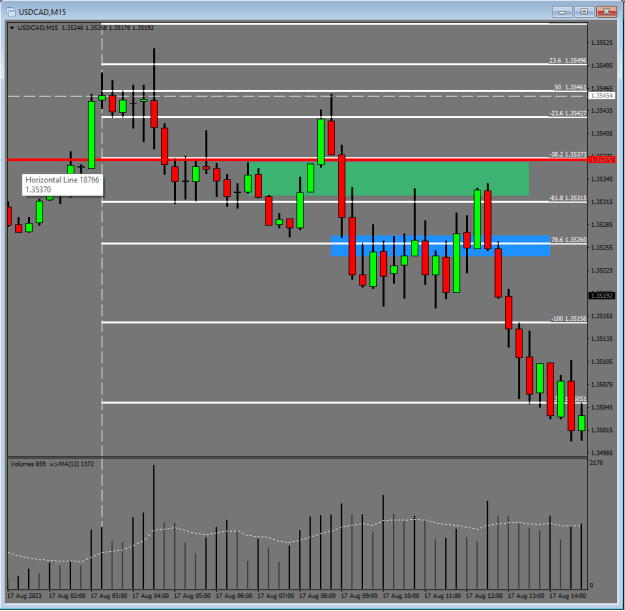
As price moves your way, protect yourself.. Using USDCAD as the same example with those expansion fibs, take partial profits as price tests those levels and bring that stop down to above the high of Bar 5, the entry bar. Congrats, if you take a partial profit of 10% of your position at the blue box then bring your stop down to just above the high of bar 5. then you just reduced your risk by 70-90% of the original risk.
Attached Image (click to enlarge)
I want you to notice something at this point. When you take a trade on Bar 5, the bar I colored with the green horizontal box. At first it appears this bar failed, price dips a little bit.. then price pushes up and through the high of Bar 5. But after when price pushes down to the profit area marked in blue, notice how price does not touch the high of bar 5 again. This is not accidental, this happens more than you think.
Yes sometimes you will get taken out because you took that partial profit too early.. but think about this for a bit.. price dropped 5 pips and you removed 70-90% of your risk from a tiny move. Thats huge.
My TPs are still a little weak, but I'll take a bit about them tomorrow. Ask questions, I will answer them best that I can.
{quote} Anotan how is it going Do you trade for a living. You trade part time or is just a hobby?
Ignored
Yeah I'm doing good pretty good, just bored at the moment.
I've been trading full time since the end of 2020. I took a lot of crazy risks in during the pandemic and it paid out well. I think at the beginning of 2020 I had 28k in my trading account, when I closed the year out a hair over 1M.
I remember posting a screen shot in sept 2020 where I made like 140k that month or something close to it. I caught a bull run on AUDUSD in Novemeber and closed it the first week of January which is really were I made something like 40% of my profits that year. I remember it took like 5 hours close the position, broker couldn't fill the positions right away.
If I'm being honest 2022 was a rough year, I lost money that year. I had to kinda reinvent my trading because I just couldn't make high volume closes work like I did during the pandemic. And things started lining up again for me this year when I started piecing things together about looking for that initial sign of strength/weakness into fresh new ground.
I want you to notice something at this point. When you take a trade on Bar 5, the bar I colored with the green horizontal box. At first it appears this bar failed, price dips a little bit.. then price pushes up and through the high of Bar 5. But after when price pushes down to the profit area marked in blue, notice how price does not touch the high of bar 5 again. This is not accidental, this happens more than you think.
Ignored
What makes this candle special? That it is low volume? That it is an entry candle? Or that is a trapped buyers candle?
If you can show more examples of this happening it may be a low risk add on or entry on its own if its consistent.