{quote} Weren't you calling 1920 only a day or two ago?
Ignored
Accept my sincere apologies that the market only graduated in 1925 and not 1920. My goal was called short about 1 week ago when many were still long. Yesterday said that closed 2/3 auf this position.
I'm not participating here in order to specify entry brands to the millimeter, but first and foremost it's always about the range and there, of course, a mistake is always possible. I wish you luck.
{quote} It closed on 1938. 1957 achievable still??
Ignored
Yes....1939 is the upper limit of that long sideways move it is assumed more secure but hourly close above previous swing high is a short term buy signal so 1954-1957 target can become achievable.Trade safe
{quote} Accept my sincere apologies that the market only graduated in 1925 and not 1920. My goal was called short about 1 week ago when many were still long. Yesterday said that closed 2/3 auf this position. I'm not participating here in order to specify entry brands to the millimeter, but first and foremost it's always about the range and there, of course, a mistake is always possible. I wish you luck.
Ignored
Well said ---- no one is here to provide signals to the exact pip ----- SOME PEOPLE SHeeeeesh You have absolutely no need to apologise to anybugger
{quote} Weren't you calling 1920 only a day or two ago?
Ignored
Most of traders loses everything only because of their arrogance and being so egoistic for chasing exact numbers in terms of TP SL or whatever. Flow like water my bro.
Green pips !!!
If you believe in yourself anything is possible !!
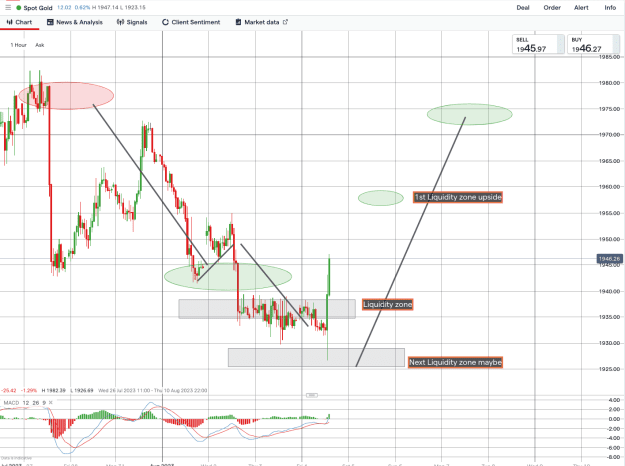
{quote}As per long term wise the target become between 2035-2045. For short term if this hourly candle close above 1939 then the first possible target become 1957. Trade safe
Ignored
This 2035-2045 is long way to go but it is definitely achievable. If we see the monthly candle, it has started very bearish and not made an upper wick. It almost came to the monthly support and rejected it. Now even if it wants to continue bearish it should definitely test 1985 area and reject it. This way it will signal that it tested that area rejected it and then continued bearish. But i feel the former looks more relevant.
{quote} Most of traders loses everything only because of their arrogance and being so egoistic for chasing exact numbers in terms of TP SL or whatever. Flow like water my bro. Green pips !!!
{quote} Accept my sincere apologies that the market only graduated in 1925 and not 1920. My goal was called short about 1 week ago when many were still long. Yesterday said that closed 2/3 auf this position. I'm not participating here in order to specify entry brands to the millimeter, but first and foremost it's always about the range and there, of course, a mistake is always possible. I wish you luck.
Ignored
_____________ @ Isabella = I LUV You 4sure ! 2gether we can Rule this fx_jungle and WipeOut all these Pesky mobile_demoers lol
Attached Image (click to enlarge)
Don’t focus on making $$$, focus on protecting what you have.
everyone should know by now what i think LOL every timcframe above 4H is bearish...the only one that still isnt is the yearly LOL here is the midyear 6M chart... price poked above the july 2020 highs highs and retreated...ill repeat it it the new modern vernacular everyone seems to be using...it grabed liquidity above the highs....also price tested the july 2011 highs and retreated yet again...how much more energy do the bulls have left? so thats why i said only the yearly chart isnt bearish YET now onto the NFP... we all know what a beating...
Ignored
Zebi do you have any gifs for Bears?? They just got whacked today lol
Probably lost their last opportunity to go down.
Joined Mar 2008
|
Status: Name real with real own way
|23,418 Posts
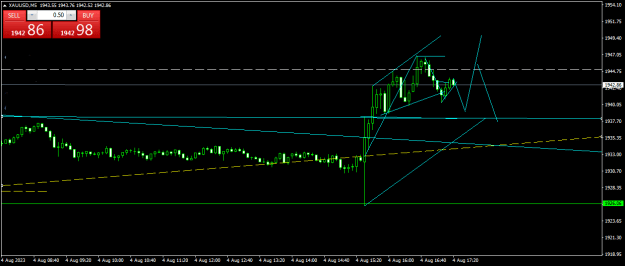
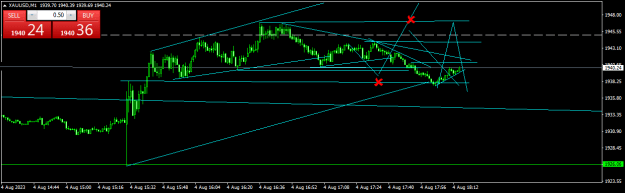
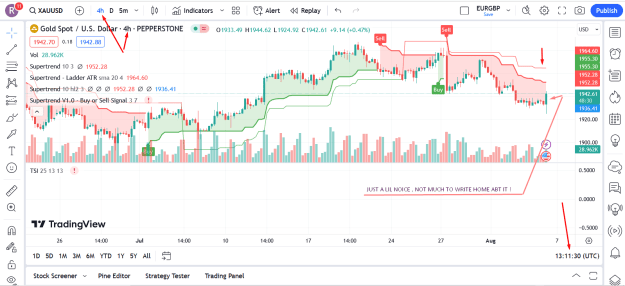
perfect news effect as per standard pa today , anyway 1946 tested but not 1948 yet, may try next over now limit 1938.27 . watching and trying follow as far possible but careful here as very narrow range from minimum correction below 1940.38/39.89 to up next lag , better not, do bull before then ?? then below 42.04 be enough to go UP if !
limit broken down , so pa changes / to top failure or becoming complex , still may bull though . co correct up over 1944.01 to previous top possible . care level over 1941/ 41.61!
Attached Image(s) (click to enlarge)
Not understand?better not follow my analyses!doubt clearer first, risks ++
perfect news effect as per standard pa today , anyway 1946 tested but not 1948 yet, may try next over now limit 1938.27 . watching and trying follow as far possible but careful here as very narrow range from minimum correction below 1940.38/39.89 to up next lag , better not, do bull before then ?? then below 42.04 be enough to go UP if ! limit broken down , so pa changes / to top failure or becoming complex , still may bull though . co correct up over 1944.01 to previous top possible . care level over 1941/ 41.61! {image} {image}
Ignored
PLEASE use google translate or speak proper english I give myself an aneurysm trying to understand half the posts on here.
perfect news effect as per standard pa today , anyway 1946 tested but not 1948 yet, may try next over now limit 1938.27 . watching and trying follow as far possible but careful here as very narrow range from minimum correction below 1940.38/39.89 to up next lag , better not, do bull before then ?? then below 42.04 be enough to go UP if ! limit broken down , so pa changes / to top failure or becoming complex , still may bull though . co correct up over 1944.01 to previous top possible . care level over 1941/ 41.61! {image} {image}
Ignored
What are you trying to say? Don't use flowery language. keep it simple