Hi Phillip, i thank you again for all that you do for us, +79 pips this week and every week im learning for the first time what i thought i knew the week before. you are a better teacher than most of the professors i had in school. Everybody have a great weeknd
Can you tell me everything that is setup as your SMA's, EMA's, Meaning of all your colors. I want to take a look at this one for the EURCHF
Ignored
Hi Ryan,
The chart you are refering to is not my usual setup, it was just part of some other ideas that I was trying out (research and development is a constant in any business). Attached is a chart of my usual setup. It is the basic MACD system as Phillip suggests with two additions that I find convienient to use. The first is the LRC (available as a standard feature in MT4). It shows me tops and bottoms of the price channel and is easy to update on an end of day basis. Breakouts from the channel often indicate trend changes in the works. I have also added the HMA (attached below) for two reasons: 1. It gives me a quick visual of current price direction and 2. It has an alert built in which I can turn on and off when needed. That way I do not have to be constantly glued to the monitor but know that I will not miss a particular move I am waiting for. Just my way of being lazy. The HMA is set at 8. Hope that helps.
Joined Dec 2006
|
Status: The price is right.
|782 Posts
Wow! A sold bounce off the median line which also coincided with the 200sma on the 1 hour chart, sure glad I stop lossed that one up tight before I went off partying last night .
Attached Image
Stay calm, be brave, wait for the signs - Jasper Friendly Bear
Hi Ryan,
The chart you are refering to is not my usual setup, it was just part of some other ideas that I was trying out (research and development is a constant in any business). Attached is a chart of my usual setup. It is the basic MACD system as Phillip suggests with two additions that I find convienient to use. The first is the LRC (available as a standard feature in MT4). It shows me tops and bottoms of the price channel and is easy to update on an end of day basis. Breakouts from the channel often indicate trend changes in the works. I have also added the HMA (attached below) for two reasons: 1. It gives me a quick visual of current price direction and 2. It has an alert built in which I can turn on and off when needed. That way I do not have to be constantly glued to the monitor but know that I will not miss a particular move I am waiting for. Just my way of being lazy. The HMA is set at 8. Hope that helps.
Ignored
Thanks. But is this the setup for thw EURCHF that you use also???
Thanks. But is this the setup for thw EURCHF that you use also???
Ignored
Yes, this is the setup that I use for the EURCHF with the addition of a 100sma. I have found that in the past year it has nicely delineated the trend legs for the long positions that I was interested in trading. Whenever price was in the vicinity of the 100sma I would look to go long with the intention of riding the trend leg. I am currently flat this market as it recently pulledback through a support area that I was using as a stop loss and my profits were banked. It seems a bit overbought at the moment (up against a very old high) and if I remember correctly is showing MACD divergence. Perhaps a secondary trend correction in the works??
Stay calm, be brave, wait for the signs - Jasper Friendly Bear
I have two questions to your last chart.
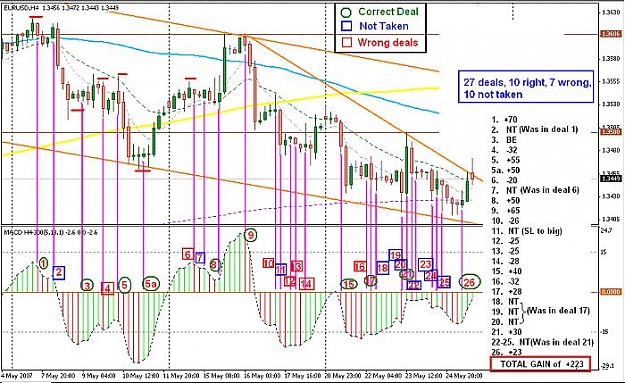
1) Could you please explain as why have you ignored the long signal from trade #2 in this case( and others similar) ?
It would be logical for me to close the short trade(#1) to reduce potential loss and open a new long trade (#2) in this case.
2) At which level and why you have closed trade #1 with 70 pips (I can not see any EMAs at this level) ?
I have two questions to your last chart.
1) Could you please explain as why have you ignored the long signal from trade #2 in this case( and others similar) ?
It would be logical for me to close the short trade(#1) to reduce potential loss and open a new long trade (#2) in this case.
2) At which level and why you have closed trade #1 with 70 pips (I can not see any EMAs at this level) ?
Hi Ryan,
The chart you are refering to is not my usual setup, it was just part of some other ideas that I was trying out (research and development is a constant in any business). Attached is a chart of my usual setup. It is the basic MACD system as Phillip suggests with two additions that I find convienient to use. The first is the LRC (available as a standard feature in MT4). It shows me tops and bottoms of the price channel and is easy to update on an end of day basis. Breakouts from the channel often indicate trend changes in the works. I have also added the HMA (attached below) for two reasons: 1. It gives me a quick visual of current price direction and 2. It has an alert built in which I can turn on and off when needed. That way I do not have to be constantly glued to the monitor but know that I will not miss a particular move I am waiting for. Just my way of being lazy. The HMA is set at 8. Hope that helps.
Ignored
Hi,
I have just been looking at the HMA (thanks for providing it BTW), and it seems really good. Any idea of how it works and what the HMA stands for. Just intrigued really as seems really good!
I couldn't find thre LRC on meta trader. COuld you point me in the right directio as to where I can get it?
Again, thanks for the attachments and explinations
Thanx to Phillip for his supreme effort, u ARE better than my teachers were..hehe...also thanx to all who make this forum as good as it is....quick question..does the MACD setting we use affect the validity,mmm not sure how to say it, "strength" of the divergence? or is divergence valid on any setting? there may be an obvious answer, but i don't know it....thanx in advance to all who answer..
I have just been looking at the HMA (thanks for providing it BTW), and it seems really good. Any idea of how it works and what the HMA stands for. Just intrigued really as seems really good!
I couldn't find thre LRC on meta trader. COuld you point me in the right directio as to where I can get it?
Again, thanks for the attachments and explinations
m
Ignored
HMA I believe stands for Hull Moving Average, not too sure about the programing details or history of this indicator, perhaps someone else has some more knowledge and can provide extra details. As far as I can tell it is basically a colour changing moving average. This particular version has a built in alert which I find handy to turn on and off as needed.
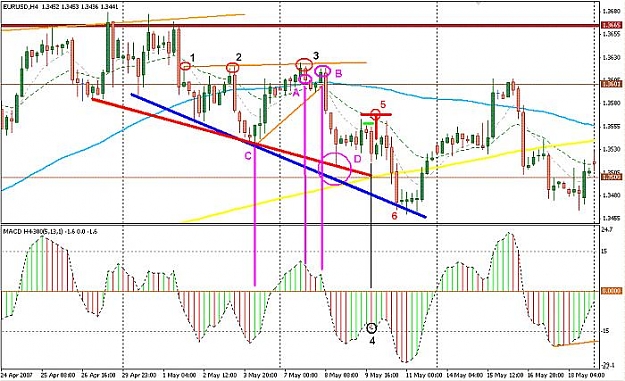
The Linear Regression Channel can be found under Insert - Channels - Linear Regression. I usually begin to draw it at on obvious trend beginning and manually update it (weekly on the 4 hour, daily on the 1 hour). When a channel breakout occurs I start a new regression channel (leaving the old one in place for a while as often there is a retrace back to the breakout area or in the case of a failed breakout, price will return to within this channel) and then carry on from there. It is just a convenient way to identify important support and resistance areas. I often use the median line as a profit taking area especially if there is confluence with a trendline, Fib, etc(see the previous post on the recent USDJPY trade). On occassion I will use it as a trade entry area if MACD agrees but prefer trade setups at channel extremes. These are usually the higher probability trades.
Hope that Helps.
Stay calm, be brave, wait for the signs - Jasper Friendly Bear
HMA I believe stands for Hull Moving Average, not too sure about the programing details or history of this indicator, perhaps someone else has some more knowledge and can provide extra details. As far as I can tell it is basically a colour changing moving average. This particular version has a built in alert which I find handy to turn on and off as needed.
The Linear Regression Channel can be found under Insert - Channels - Linear Regression. I usually begin to draw it at on obvious trend beginning and manually update it (weekly on the 4 hour, daily on the 1 hour). When a channel breakout occurs I start a new regression channel (leaving the old one in place for a while as often there is a retrace back to the breakout area or in the case of a failed breakout, price will return to within this channel) and then carry on from there. It is just a convenient way to identify important support and resistance areas. I often use the median line as a profit taking area especially if there is confluence with a trendline, Fib, etc(see the previous post on the recent USDJPY trade). On occassion I will use it as a trade entry area if MACD agrees but prefer trade setups at channel extremes. These are usually the higher probability trades.
Hope that Helps.
To go along with that Phillip said here, price analysis really would have helped just blindly trading the macd here. Trades 10, for example--the signal bar indicating a RB was actually a pinbar with a huge shadow going up. Not a good sign for a long trade. Likewise with Trade 14. It wound up being the right move, but waiting for a better price bar, as the next one was, would have been a better idea, and you wouldn't have had the drawdown either.
Phillip, thanks for your analysis--it's invaluable in helping us learn to use price and MACD.