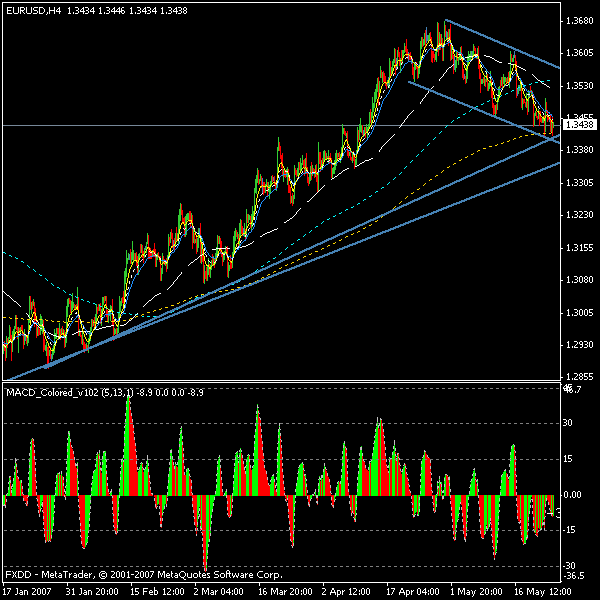
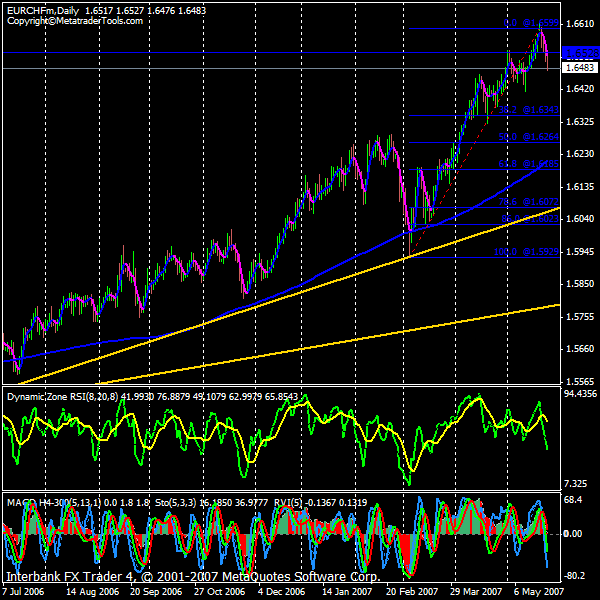
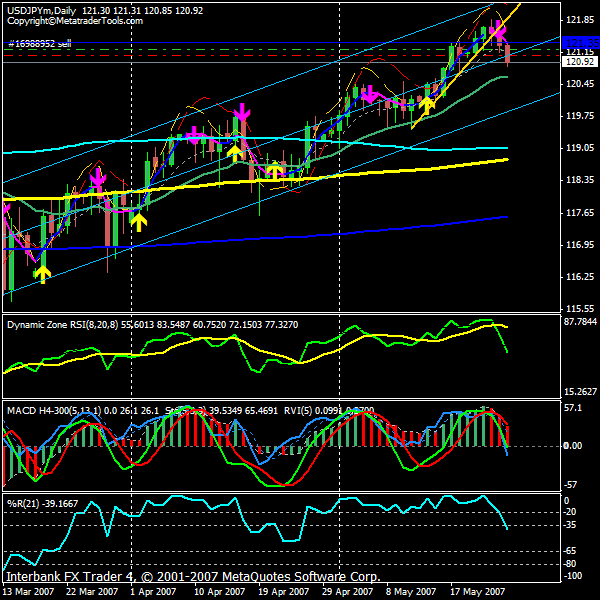
Just a note on the Euor$..
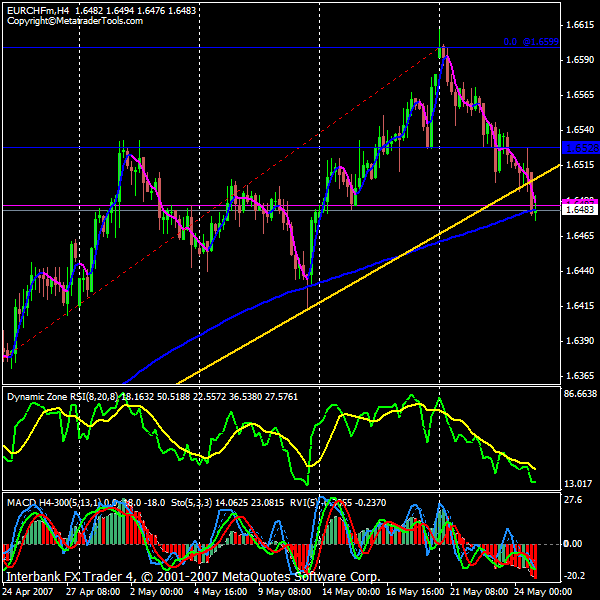
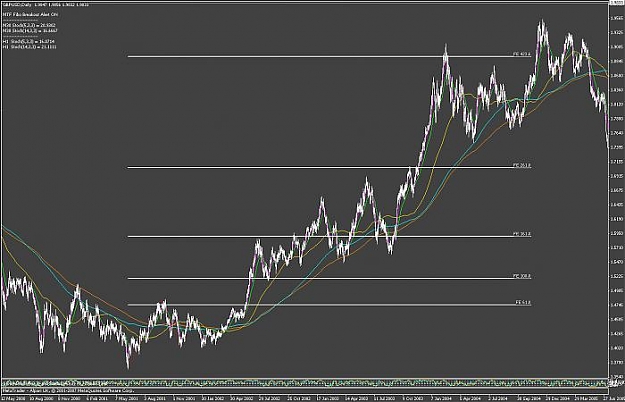
Had to squeeeeze the chart to get this but price is at the bottom of the current channel and is also on an uptrend line...
Had to squeeeeze the chart to get this but price is at the bottom of the current channel and is also on an uptrend line...
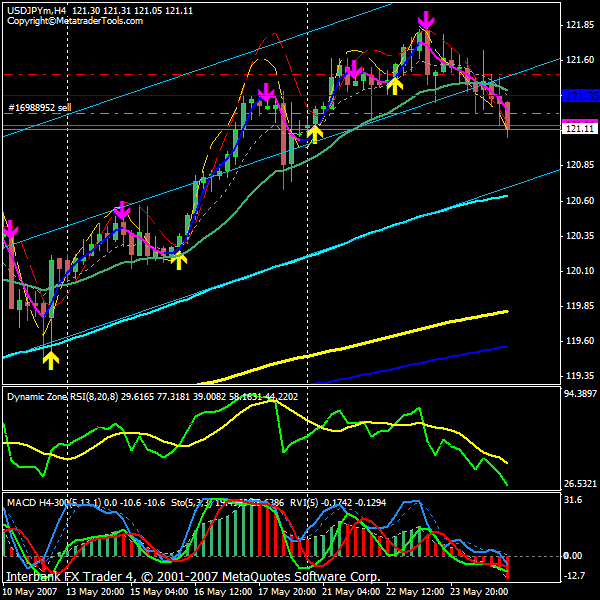
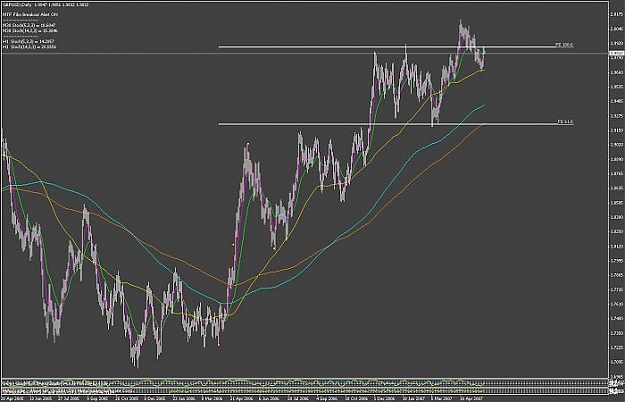
Attached Image