If anybody have these books in pdf format please share with me in { email address deleted by staff }
Stock Trading Using Planetary Cycles - The Gann Method Volume 1 - By Michael Jenkins
Stock Trading Using Planetary Cycles - The Gann Method Volume II - By Michael Jenkins
Gann Astro Vol III - Advanced Astrology - Horoscopes and Trading Methods - By Michael Jenkins
Hello to all members in this interesting thread! I am new here and I have been trying to learn concepts from Michael Jenkins materials. Hope to learn from all of you experts here!
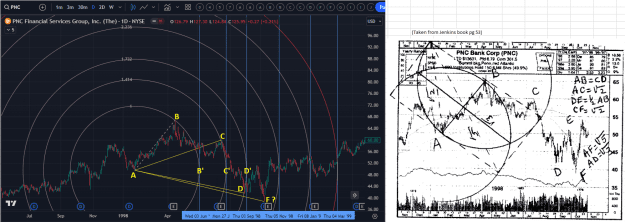
I have a question about the topic on Circles (reference to page 53 in the book "THE SECRET SCIENCE OF THE STOCK MARKET"). I tried studying the example found in Jenkins' illustration. I try to draw out the actual square root ratio circles with respect to the IMPULSE WAVE (line AB). But I do not understand if Jenkins' method of using these circles/distance is:
[1] to find reversal when the price touches the circumference of the circles (eg. B, C, D),
[2] or was it meant to only use the 3pm location (eg. B', C', D') based on the arcs as timebars where reversal may happen? I actually thought Jenkins meant this, but from the charts, using these do not show any accurate reversals.
Hope some one can enlighten me on this. Thank you very much in advance
{quote} Diamond IMHO it is always better to SIMPLIFY rather than COMPLEXIFY if we want to uncover the structure of Price Action. Hence it is IMHO better to generate 2 Charts showing Price Time Relationships of Swings of the same degree - here the Swings fluctuating within the Envelope 32 and the Swings of the higher AdjacentDegree. Only after that you can generate a chart mixing both degree of swings and check if it brings more clarity or more confusion.
Ignored
thanks for your input. After reading loads of information provided by Mr. Jenkins its hugely satisfying to see people like you and others putting it into practice.
My question is how do you make the horizontal bar vertical with the exact ranger. I tried it but its getting off a bit. Pleasehelp. Thanks
Hello to all members in this interesting thread! I am new here and I have been trying to learn concepts from Michael Jenkins materials. Hope to learn from all of you experts here! I have a question about the topic on Circles (reference to page 53 in the book "THE SECRET SCIENCE OF THE STOCK MARKET"). I tried studying the example found in Jenkins' illustration. I try to draw out the actual square root ratio circles with respect to the IMPULSE WAVE (line AB). But I do not understand if Jenkins' method of using these circles/distance is: [1] to find...
Ignored
It just does not work , more precisely it works in specific conditions. But nobody has ever posted a trade in advance using this "method".
You tried (thanks to you) and you failed . You are not the first and not the last
Hello to all members in this interesting thread! I am new here and I have been trying to learn concepts from Michael Jenkins materials. Hope to learn from all of you experts here! I have a question about the topic on Circles (reference to page 53 in the book "THE SECRET SCIENCE OF THE STOCK MARKET"). I tried studying the example found in Jenkins' illustration. I try to draw out the actual square root ratio circles with respect to the IMPULSE WAVE (line AB). But I do not understand if Jenkins' method of using these circles/distance is: [1] to find...
Ignored
This is an excerpt of Jenkins last book published in 2022 " 50 years of Day Trading"
Does somebody can translate that for me ?
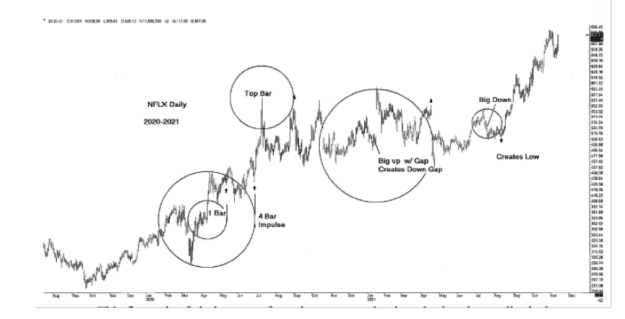
This first pair of circles come from the same starting impulse but the smaller is the one day size, and the larger 4 bars is the complete impulse until it reversed down.
Often solitary top or bottom bars are good indications turned sideways if they are 'big' enough showing cyclical climax. characteristics.
The third set of circles show what often happens and is a sign you have the right cycle length.
Then you will start with a 'gap' up and end with the same size 'gap' down with a mirror image foldback in between.
Note above that usually a big bar up impulse in an uptrend will have its cycle end point
resolution a low and start of another up move, whereas a big bar impulse in a breakdown or downtrend will see its resolution a high or a start of another breakdown.
Always be aware of BIG BARS. They mean something and it's best to think about just what they do mean for the coming days.
A ‘big' bar can easily be identified on your software with a listing of the 'average true range’ or the price difference between the extreme high of the day and the extreme low of the day.
{quote} It just does not work , more precisely it works in specific conditions. But nobody has ever posted a trade in advance using this "method". You tried (thanks to you) and you failed . You are not the first and not the last {image}
I used to take Jenkins very seriously and read all his books and watched some of his videos. Tried all sin- cos- tan, circles, squares, square roots, secret angles etc. At times these methods work but most of the times, atleast in my case I was better off without his methods. One is the time consumed in drawing and secondly the hit or miss (probability). Also if you are on tradingview or gocharting, the drawing tools are quite limited.
We all came to this business from infinite ways and backgrounds, and not every concept/idea will resonate with us the same
Jim Rhon used to say, it's IDEAS, one more idea, unlocks new ways for you (paraphrased)
Just like when you learned to write, or ride a bike, your mind had to assimilate varied information/ideas, and make them your OWN
Capt. Jack (John Saffron) said, the point is not to be RIGHT, the point is to MAKE MONEY
People can discuss all day long about your walking style, the point is it gets you from point A to B...
For me, Jenkins' work lit a few lightbulbs along my way, added several tools to my box (manipulating time, mathematical S/Rs, 45 & 90 degrees, measured moves)
I come from a rich continent, and I appreciate that to find gold, or make a tin-full of AAA tea, you have to go through alot of dirt/bushes
I used to take Jenkins very seriously and read all his books and watched some of his videos. Tried all sin- cos- tan, circles, squares, square roots, secret angles etc. At times these methods work but most of the times, atleast in my case I was better off without his methods. One is the time consumed in drawing and secondly the hit or miss (probability). Also if you are on tradingview or gocharting, the drawing tools are quite limited.
Ignored
Hi @aptx,
I can agree with you on some of your mentioned points. I am a tradingview user as well, and it does not come with convenient indicators to apply directly for most of Jenkins' tools, and I have to code it one by one to try to get close to what is expected. And the hits and misses forecasting reversals are part and parcel of the game and can be expected (so does most other indicators as well). But the Jenkins tools still come in handy, as it allow us to pre-mark the time bars where we may expect a reversal. And when it does in real time, it gives us confidence to enter the trade (alongside with using other technical indicators and price action for confluence).
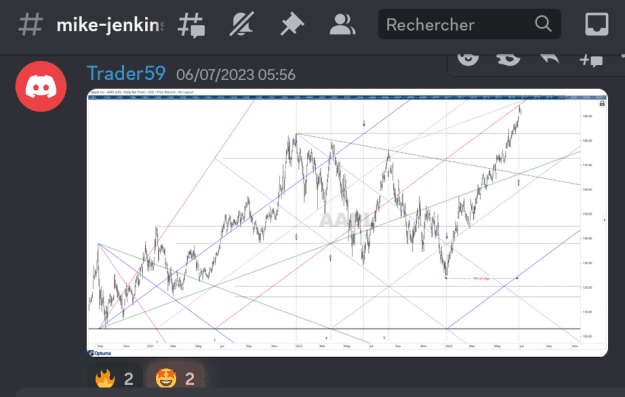
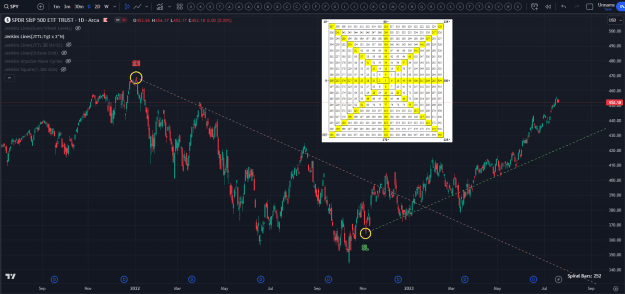
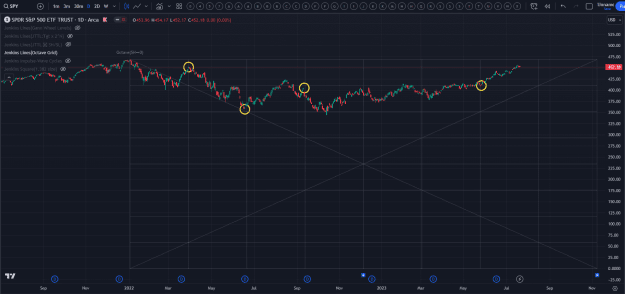
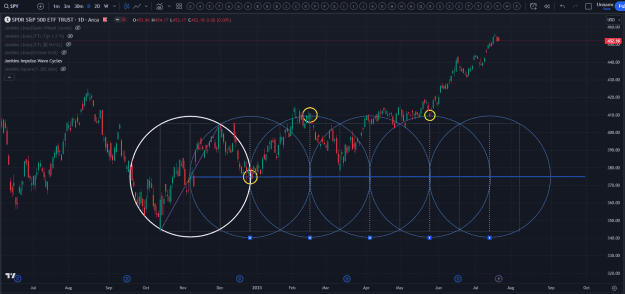
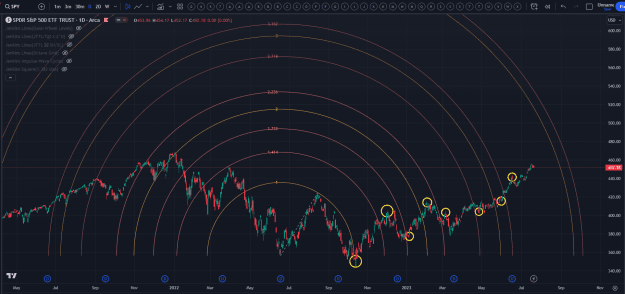
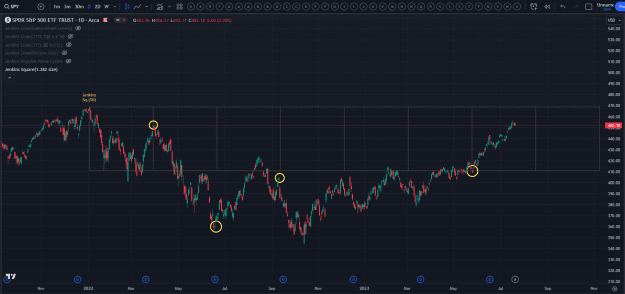
To illustrate that tradingview can still be useful (albeit lots of coding is needed), here I share some charts that are applying the Jenkins tools that I have created using pine script based on the teachings from his book. The yellow circles mark the approximate area where price reversal occur nearby or exactly at the predicted points. The tools include:
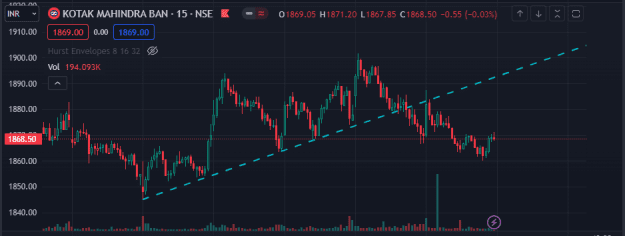
Jenkins True Trend Line
Jenkins Octave Grid Lines
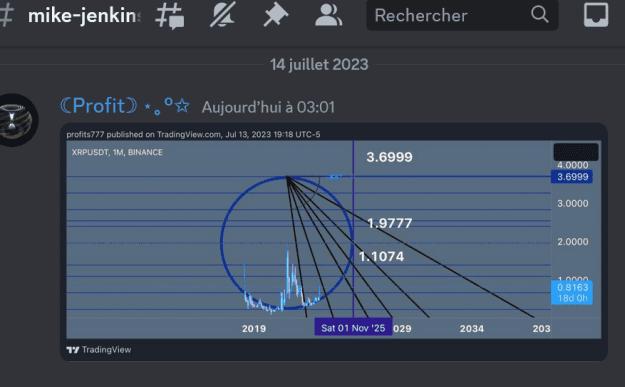
Jenkins Overlapping Circles originated from an Impulse Wave
Jenkins Circles at Special Square Root Ratios & Multiples
Jenkins Squares expanded at 1.382 size
I haven't read this book (although I've seen a lot of Jenkin's work before) so I don't know the context of that page. Is he talking about setting up your chart scale?
I think what he is doing is using the circles to find a valid chart scale, balancing time and price. When the bar height (or the complete move height) rotated 90 degrees lines up with either turns or gaps on the edges of the circle, that's a sign of a proper time-price scaling. Like with his "Time Conversion Bars".
I suspect (just by eye, I haven't drawn it) that if you use these circles as the scale for a 45 degree line or 1x1 angle, this angle from the low of the chart on the left would intersect with the multi-month high labelled "top bar".
Jenkins is one of those highly creative people whose writing is mostly stream-of-consciousness and he throws lots of ideas out there in his books, and lacking an editor, it takes a lot of effort to disentangle what he's actually talking about.
{quote} This is an excerpt of Jenkins last book published in 2022 " 50 years of Day Trading" Does somebody can translate that for me ? This first pair of circles come from the same starting impulse but the smaller is the one day size, and the larger 4 bars is the complete impulse until it reversed down. Often solitary top or bottom bars are good indications turned sideways if they are 'big' enough showing cyclical climax. characteristics. The third set of circles show what often happens and is a sign you have the right cycle length. Then you will...
I used to take Jenkins very seriously and read all his books and watched some of his videos. Tried all sin- cos- tan, circles, squares, square roots, secret angles etc. At times these methods work but most of the times, atleast in my case I was better off without his methods. One is the time consumed in drawing and secondly the hit or miss (probability). Also if you are on tradingview or gocharting, the drawing tools are quite limited.
Ignored
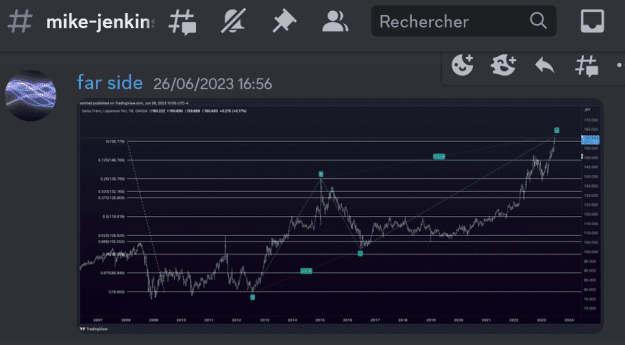
The only place (if I recall) that Jenkins explained how to actually use his methods in practical trading was in his 6 or 7 hour trading video. The key point there is that you don't just look at e.g. one angle, trig factor or time count to take a trade but find convergence of multiple things at target zones, e.g. a measured move, plus ideally the alignment of m/n angles scaled based on the first impulsive move.
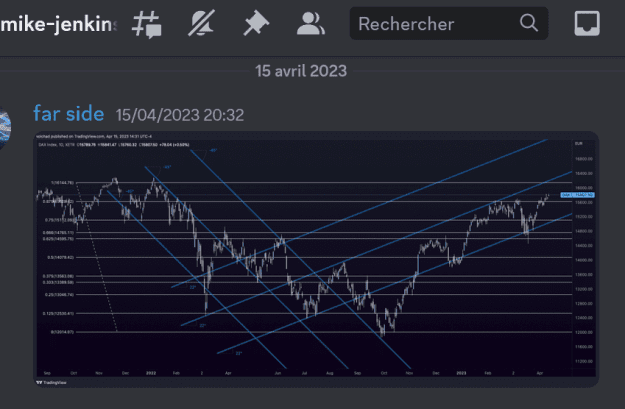
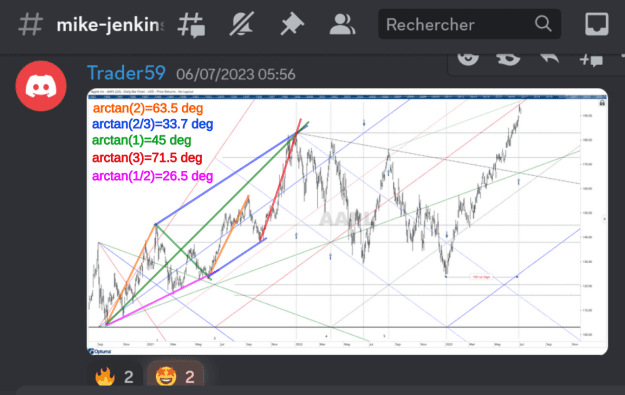
Here's an example drawn over an earlier chart someone posted. You can see its much clearer than the original lines, what I did was set the 2x1 angle (63.5 degrees) scaled from the low to the first major high in orange, then arctan(m/n) angles as labelled for the various other lines. The intersection of three angles gives the high that holds for a more than a year.