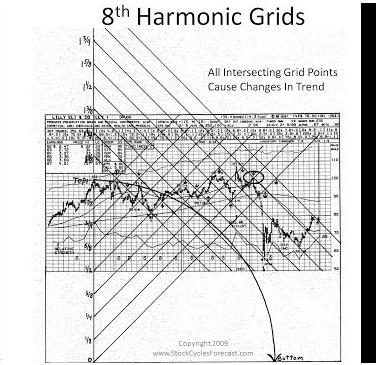
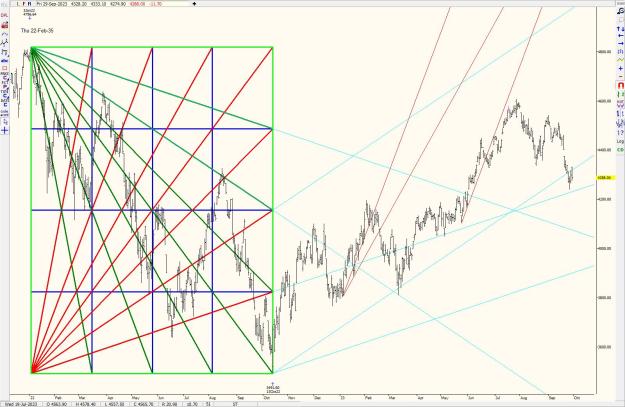
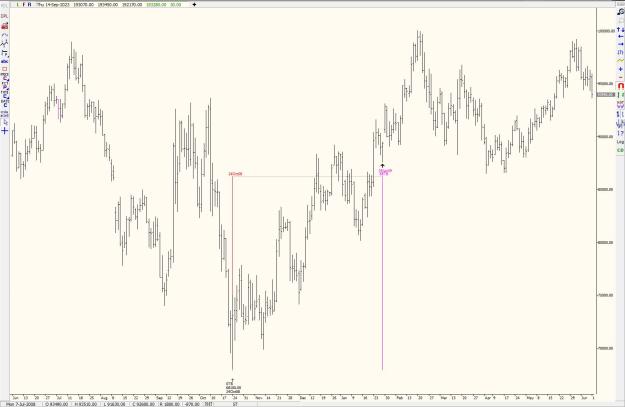
There was a section in the Secret Science book that discuss about identifying spots where the JTTL line intersects with a swing high/low to forecast the timezone of where a market may start to reverse. This concept is similar to squaring the range as well and I personally find it rather useful. Here is an example, but I am using JTTL fan lines instead of just a single line. Is there any one in this forum who also uses this method for analysis? {image}
Ignored
I have used it a few times. It's powerful, but you need to have a sense of the overall direction, as these turns can be minor within a higher timeframe idea. Nevertheless, like every system, there's a perfect opportunity for it. If you've used trendlines and support/resistance zones for a while, you'll notice that the intersection of right angles with support/resistance areas creates price turns. Let's call it 'squaring of the range,' etc. It works when it works. I am not entirely invested in Jenkins' approach, but he has some strong concepts. Simplifying it is always my main agenda. The last thing I need is to have a thousand lines on my chart when making a decision. However, I can recall from actual live tests that M5 was ultra-accurate, but it's 'M5.' So, when using such a small timeframe, one should already have analyzed the higher timeframe idea and only use it for pinpointing the time/session/day.
{quote} I have used it a few times. It's powerful, but you need to have a sense of the overall direction, as these turns can be minor within a higher timeframe idea. Nevertheless, like every system, there's a perfect opportunity for it. If you've used trendlines and support/resistance zones for a while, you'll notice that the intersection of right angles with support/resistance areas creates price turns. Let's call it 'squaring of the range,' etc. It works when it works. I am not entirely invested in Jenkins' approach, but he has some strong concepts....
Ignored
Great reply there! Yes, I can agree with most of what you had mentioned. Jenkins offered too many different methods to analyse the geometry of price charts, and the challenge to the individual will be finding the one or few that really suits him best. Not all of his tools are worth using as well (eg. I prefer squares and lines over the circles). As i trade mostly in stocks and ETFs, hence certain tools may only be fitting for stocks rather than forex ... or that some tweaking/adjustments of the tools may be required in order to fit the different markets.
HI. I am new to Jenkins's teachings and I was wondering if anyone could share his astrology trading books, specifiaally
1. Stock Trading Using Planetary Cycles - The Gann Method Volume 1
2. Stock Trading Using Planetary Cycles - The Gann Method Volume II
3. Gann Astro Vol III - Advanced Astrology - Horoscopes and Trading Methods
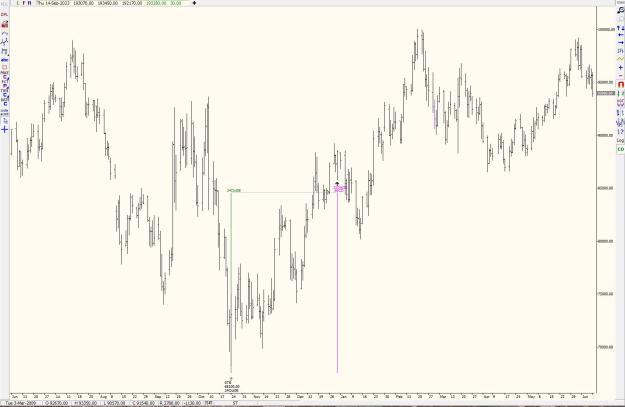
There was a section in the Secret Science book that discuss about identifying spots where the JTTL line intersects with a swing high/low to forecast the timezone of where a market may start to reverse. This concept is similar to squaring the range as well and I personally find it rather useful. Here is an example, but I am using JTTL fan lines instead of just a single line. Is there any one in this forum who also uses this method for analysis? {image}
I would get his [Jenkins} ASTRO courses - they reveal the true "hidden" veil that he uses the JTTL for - In his science courses he has totally "dumbed" down (exactly like GANN) the true meaning of everything as like Gann, he didn't want to or plan to reveal the true meaning of everything, so that's why lots of his basic stuff isn't consistent
Jenkins never planned to write his ASTRO courses, hence why his previous courses were written in a veiled language not revealing the true meaning of it all - His ASTO course are not complete either, as he reveals much more in his personal seminars
In any rate, you don't need all this stuff or the ASTRO stuff to trade - All you need to have is some method of Identifying and tracking a STRONG trend and just go with it on daily and weekly charts and you'll make a very handsome Income/return
In the chart above in Waverider75 post directly above this post - LONG only = Look at the Impulse upwards thrusts, small pullback/correction, then whoosh off upwards again - buy long @ the correction/pullback or on the break of the prev high and trail - you can make exceptional returns by looking for those price thrust formations across hundreds of markets - keep things simple, this is basically the multi-decade old "123 or Ross hook method"
JTTL with the sqrt +2 = using the SUN, hence the 1 full rotation around the square and in 1 year - different square roots can be used and years to use as square outs as per the book and they work fairly well - Obviously if a differing time value is in play then you won't get good trades from the JTTL if using sqrt +2, but you'll get a few hits regardless
I would also invest in Bradley F Cowans Pentagonal Time Cycle Theory as that gives you a complete grounding in what the USA markets are doing and going to do, from that you can then "predict" with high degree economic factors that should be seen in the economy etc - i.e. If Cowan is right and the SP500 moves in a 18 year UP/Inflationary cycle, you'd seen all the trappings that come with an Inflationary environment, Rising Inflation (credit + price), rising Interest rates etc etc - even Covid shutdown hasn't done too much damage as it would of done if it [covid] had happened during a DOWN/DEFLATIONARY cycle such as in 2000-2016
I read through this one. starting on page 1.. and it gradually until current page turned into "jenkins is a scam". search for forex on youtube, you will find scams, most of the results. I have been doing normal stocks at several periods of time the last 25 years, and started to look into forex a few weeks ago, and basically I could argue Forex in itself beeing a scam for retail traders.. (2% / day on a consistent basis would equal to these people beeing so rich within few years the last thing they would do is to spend time on youtube teaching others.. they are there pushing rsi, moving averages oscillators and bands getting some kind of payment from their respective brokers, AND THAT.. is their income!! . If they need to do affiliation business this tells me all their teaching and all their methods are bullcrap.
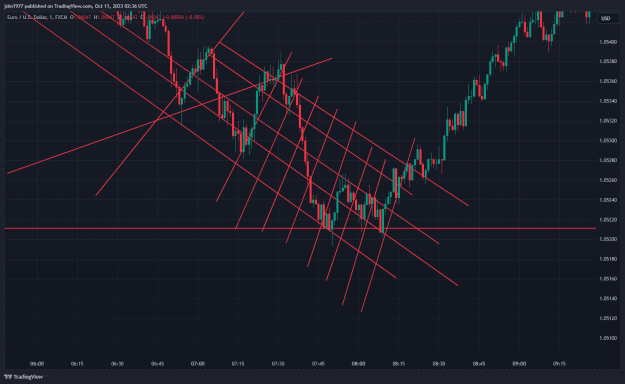
The actual reason I came past Jenkins (Yesterday) was a chart I played with a few days ago, and found that there might be lines at certain intervals providing support and resistance naturally, in wich is partly covered in the broad using technical analysis, but I dont think technical analysis takes it far enough, and also technical analysis becomes less usable if you want to do quick 5-10 pips on a 1-3 minute intraday chart sais in a simplistic style. technical analysis is not predictive in short term, and can as I see only give you insights and a general forecast of what might happend if nothing unexpected should occur.
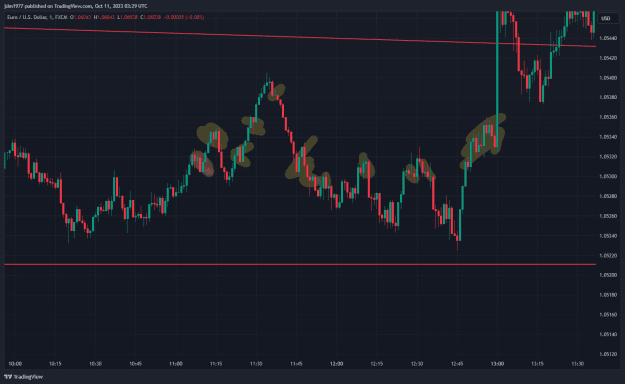
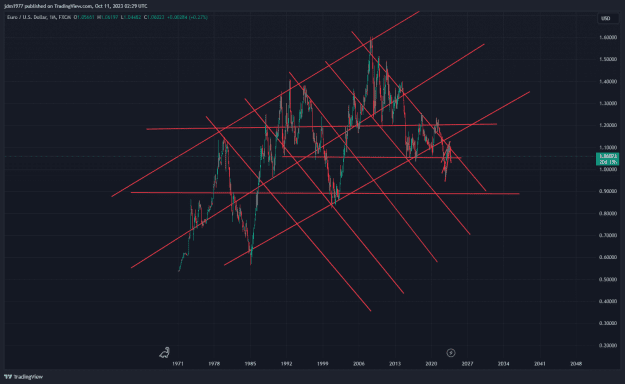
The enclosed pictures of snapshots from tradingview is a 1Month chart and a 1min chart of eurusd showing my quadrants (before I found Gann/Jenkins) black/white picture is a screenshot of Jenkins " 8th harmonic grids" wich is basically the same. Mr. Jenkins is, and I include the disclaimer that you should not remotely diagnose people) probably somewhere in the autistic spectrum, or in other words maybe a nutty professor and I do detect after wathing some speeches he have had not a great educator but its these people who have insights and gain insights that most other people dont see, because we can in many cases only apply what we have learned and build a little on that, not coming up with new ideas and concepts. In that regards, Jenkins is special.
I got dizzy when he started to speak about planets, I choose to think of it in another way: planets have different mass and size - the ones who has survived and is still there is probably a result of survival of the fittest, their attributes of speed, mass and size, archs, harmonics, frequenzy is probably unique and interesting and the different factors you can get out of them might have some relevance into other aspects too survival of the fittest curve, for instance..
On the path of a downward or upward line, those "stop-points" cause me anxiety and I always have been thinking time must be some kind of factor too you can see on a downward line, the pips are ticking in (on your demo account) suddenly you get one of those points where it go up, and you dont know if you should stop the trade, or hold in.
Then it go sideways, suddenly one up - anxiety raise and you can on the 1 minute see its stopping, and hammering trying to get down.
Sometimes it get through, and something it shoots up, and trigger the stoploss in wich a youtuber said always should be on 2% of your total (demo) account.
Here I have highlighted the points of anxiety, wich is also corresponding to the gridstructure on my original grid in wich Jenkins probably call 8th harmonics.
They repeat, they are "kind of" consistent, I want to know more to maybe make me able to do better choices within the short timeframe before things happends, or at least reduce the anxiety if I with more than 50% certainty can know what is most likely to happend. the scale do not matter if its a 1 minute, 5 minute, 30 minute or a 1 hour.. if you are in a longer period trade, you can go to the 1 minute chart and see the hammeirng happening in real time at some line and basically some times, that micro hammerings result is stop loss or continue down to take profit. Also, for instance if the price go down x pip, many times it goes up again the same amount or more within "some period of time" suddenly and violently, seems like Jenkins have some theories there, and I cant wait to start exploring it tomorrow.
Attached Image (click to enlarge)
so for those who think jenkins is a scam, please share your insights of whats better and/or let people make up their own opinion. If by exploring Jenkins and Gann a few months / weeks can give 2-3 insights and a tool or two wich is useful for an individual is better to explore and make up your own mind, and not listen to others. Also, when reading something like this, I think one must think broader. I have read several religious books without naming them, but one of them for instance say you should not eat pig meat, and another warn about seafood. I interpret this as sometime in history, they have had some problems with respective like pigflu.. finally found out, and to make sure it never happends again simply banned it by religion. Same story with the other book and seafood. obviously with todays knowledge, improperly stored or hygiene problems might change the most delicious salmon into a potential deathtrap.
if interested, I can share if I find something useful after study this a month or two.. but if I find gold, I can ensure you I will keep it to myself. Again. here is the quadrants I drawed myself before reading anything of this, and these are the reason I ended up here today reading about jenkins and Gann.. my feeling is to explore more and not continue looking at youtube videos about rsi and moving averages and divergence or "super oscillator earned me a ferrari in a week on forex".
For now, I say "when time is up, price must change"
This is slightly off the Jenkins path, BUT, its related and is well worth thinking about, as it ALL relates to circles, squares, sacred geometry etc etc and proves that the markets are not random
Working out Time Cycles alerts you to high probability reversals, all these examples are for the SP500 stock market
This ones from Brad Cowans Pentagonal book - 18th Aug 2015 - worth seeing what the market did on that date for a great prediction that you could have made decades earlier
Attached Image (click to enlarge)
I've always been fascinated by markets stopping dead out of the blue and then reversing
2 such times this happened on the SP500 was the 2009 LOW at 666.79 and it stopped at a drop/fall of 57.69% and in 2020 when it stopped dead and reversed at 35.41% of the high
Jenkins in his books talks about the Square roots of 2, 3 5 etc - this is where these numbers come from
Just like using Fib ratios expanding or contracting you can do the same with square roots
Square root of 2 is the SQUARE and all you do is divide 1 by the sqrt2 or 1.4142, then repeat to get the key ratios of the SQUARE - eventually you will come to 35.4
Then consider that the SP500 stopped within 0.01% of perfection of that ratio - which proves that the SP500 at that time was working out to the maths of the SQUARE - 1.4142 is the diagonal of the SQUARE
Now back to the 2009 low - 57.69% fall = divide 1 by sqrt3 or 1.732 - this is also a triangle TAN number - but the ratio does not belong in the group of the square, it belongs to the CUBE as the sqrt3 or 1.732 is the diagonal of a CUBE
I would encourage you all to create a list if contractions of FIB series, SQUARE series, CUBE series and of sqrt5 2.236
At the basic level running these ratios will show you times when the market has stopped dead on these levels exactly and bounced - showing you levels in addition to the traditional FIB ratios etc
OK - so now do the same but EXPAND the ratios past 1 - i.e. in the SQUARE series 1 x 1.4142 = 1.4142 x 1.4142 = 2 etc etc etc
You'll need to do the same for the Fib series, Square series, Cube series etc
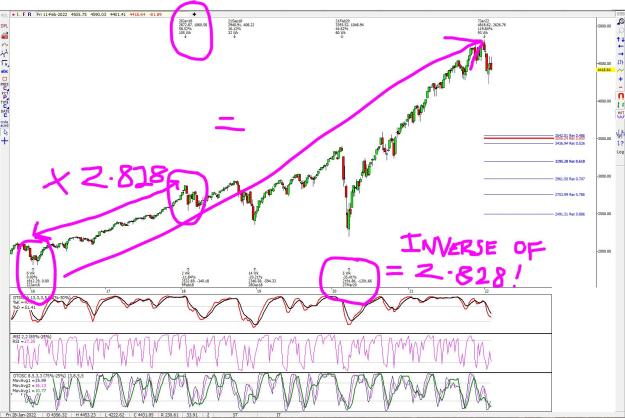
The next 2 charts should be easy enough to understand and you could of timed the high within points
Range of 2016 low to 2018 high, multiplied by 2.828, projected from 2016 LOW - 2.828 is a EXPANDING ratio of the SQUARE - 35.4 is the reciprocal of 2.828 in the SQUARE series and is obviously a contracting ratio of the SQUARE
Attached Image (click to enlarge)
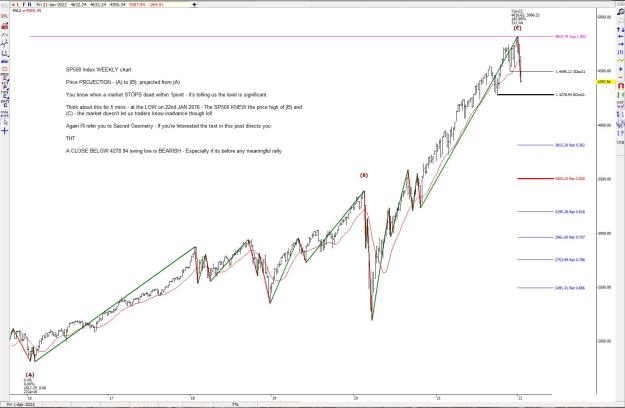
This chart shows a projection using the diagonal ratio of a GOLDEN RECTANGLE 1.902
Attached Image (click to enlarge)
when 2 really big long term ratios like these placed together within a couple of points - its fairly significant (as it turned out to be) - not shown but a properly scaled 1 x 1 Gann angle from the 2009 low on the DJIA had 2 touches of the angle before turning down at the same date
The decline from the Jan 2022 HIGH was also a 50% retracement and 50% is a contracting ratio of the SQUARE series - slight overshoot as the market was obviously working to the 1 x 1 Gann DOWN angle to perfection
Attached Image (click to enlarge)
The canon of proportion is significant in the markets, it underpins most of Jenkins work, is applicable to time and price and is found in the Great Pyramid as well as Gann's squares
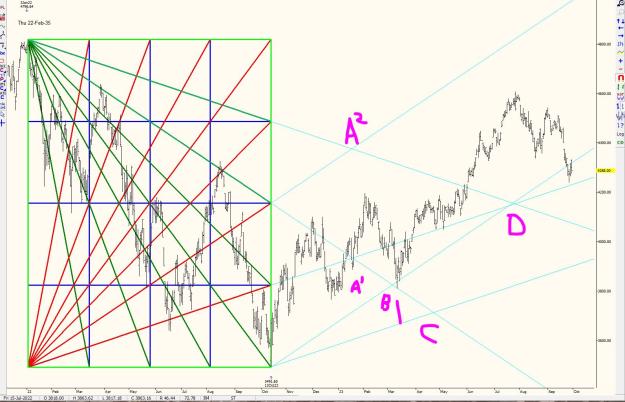
Back onto Jenkins methods - His most recent book "Day trading for 50 years" details basic methods people can use (you need his Astro books for market swings/highs and lows etc)
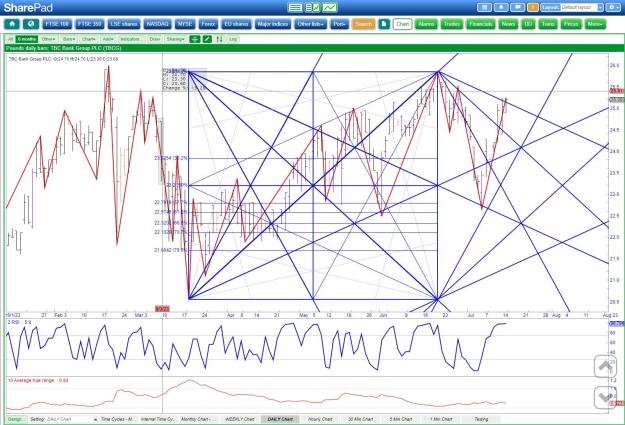
Shows you many chapters - this one is his grid system - Find a nice market swing
The GEOMETRY of the grid - angles extended
Notice the letters at the angle crossing places - caused the market to turn to some degree - having other methods to assess overbought/oversold ness etc could help you to make decisions here
"D" arrived at the gann angle down and the crossing of the extended grid/box angles!
Take note of the ANGLE hit labelled "1" which is the extended angle from the 50% section of the box/grid - a perfect reversal from there!
Attached Image (click to enlarge)
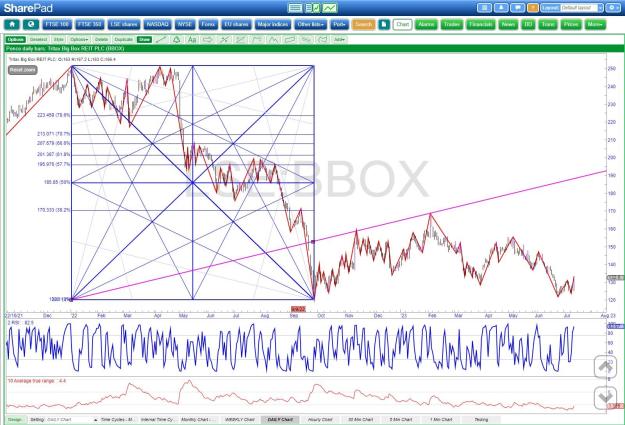
To show you that this is not a fluke - look at the other charts on these extended angles
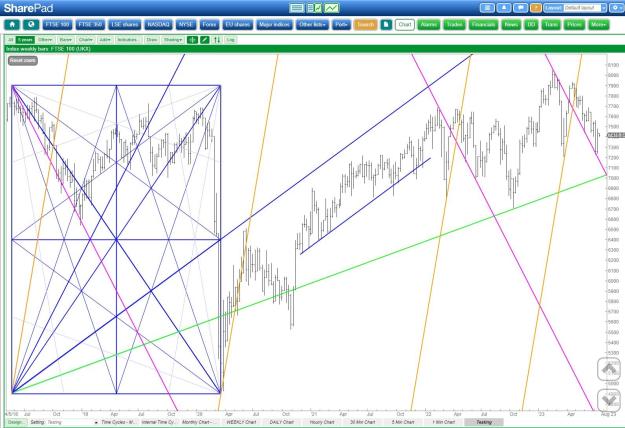
In this next chart we've simply copied the steep angles and as Jenkins says place them at the lows of thrusting impulses upwards and you can simply buy into the momentum and use the trendline as a stop - I did the same in the FTSE100 Index chart above - IF the market is active and bullish, then the highs will get higher and the lows higher too
Attached Image (click to enlarge)
So although Jenkins normal books don't reveal the secrets to the markets, they do work - the trouble is traders want the holy grail of knowing tops and bottoms
When you take a steep trendline from the well formed swing grid/box and price is running up away from it, you can make hundreds of pips/points - your Initial stop does not need to be on the trendline, it can be a lot closer to the market, you might need a couple of attempts at the trade but as long as you come out with profits who cares
As you can see with the FTSE100 chart - the first few hits off the 25% angle, weren't that great, profitable, but you don't want price to faff at these angles, they are either "active" or not, then the 3rd attempt! What a trade that was!
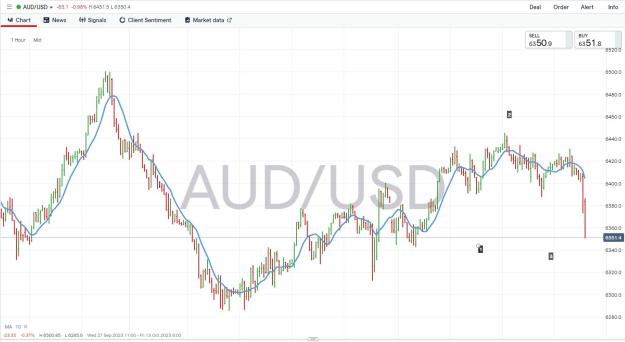
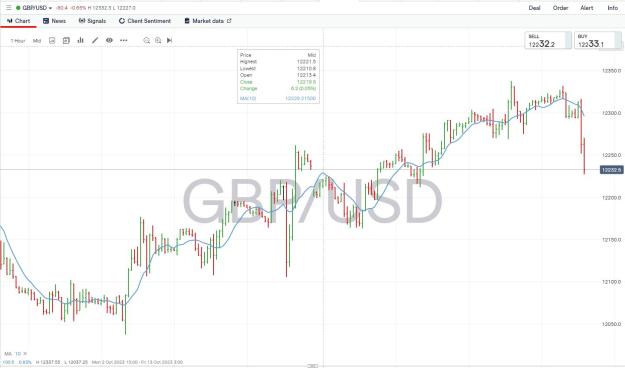
2 very quick "scalps" see charts based on Jenkins "Impulse" bar method
Shorted @ Low of the BIG impulse bar - usually I would leave to run, but I have to nip out soon hence the "scalp"
Attached Image (click to enlarge)
Attached Image (click to enlarge)
Very basic price plays - the key is with the big bars that some form of "energy" has been injected into the market and you just go with it
If you can't or don't want to just go with the flow, then it is perfectly (I do it lots of times and did it this time) fine to double or triple risk/size and reduce the target to get the same monetary outcome
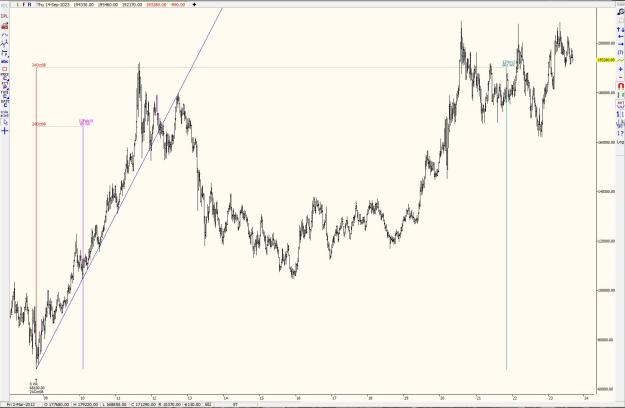
Nasdaq has completed its full Price=Time Gann square on 28/Jul/2023 (reference to 22/Nov/2021 and 13/Oct/2022 anchor points). This might be the start of a correction wave either soon or already so. {image}
Ignored
Seems like this approach has been successful in catching the correction. It provided a very close date. What do you say about this, @parisboy? Do you think it's luck?
Probably covering old ground, but might help people struggling with this all
I would not move on from this point in trying to understand Gann, Astro or Jenkins until you come to 100% terms with the following statement:
Price & Time ARE THE SAME THING
This can be measured in price, time or planetary methods - so a price of 10 could MEAN £10, 10pence, 10 hours, 10 days, 10 weeks, 10 months, 10 years or 10 DEGREES of planets or combinations of planets
You can also use mathematical values of the main number i.e. 100 (10 x 10) etc
This is crucially IMPORTANT
Also is the fact that although this key turning points REPEAT in the future, but also you have price and time balances from the PAST happening at the same time as current price and time starting points etc - this is why you can't apply "logic" to markets and trade them based common sense logical analysis etc
As everything moves around a circle its [planets and combo's of planets] are hitting old key points of the circle created by planets of the PAST
Brad Cowan in Pent Time Cycle Theory - shows key planets at the BIRTH horoscope of the NYSE in 1792 and then shows planets crossing those key sensitive pentagram points at stock market crashes and the like
Jenkins shows similar in his Astro works with natal positions
Keeping it really simple, here's a plain old PRICE for TIME conversion (NO planets) - you would be well advised to test with planets using the PRICE as full degrees or move the decimal point for various planets
This GOLD from the Oct 2008 LOW - us the PRICE 681 as hours, days, weeks, months etc
You can bet your life that in 68.1 YEARS there will be some form of swing low or high to some degree
As you can see, the market reacted to ALL these timings - some more than others, but the KEY thing is ALL those timings got a move of some sort - as traders we want the BIG moves - so obviously you can't use these plain old days/weeks/months etc and expect them all to work, this means you have to adopt other methods in seeking out the turning points etc
Obviously the WEEKLY time frame was the one that worked out from the price - All Gann was showing us was that these key prices at key turns will repeat somehow in TIME periods in the future
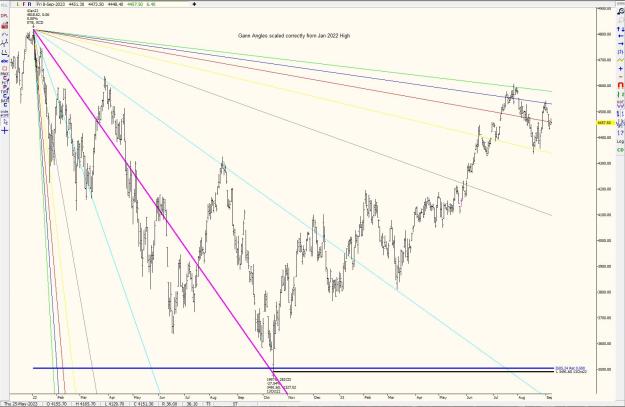
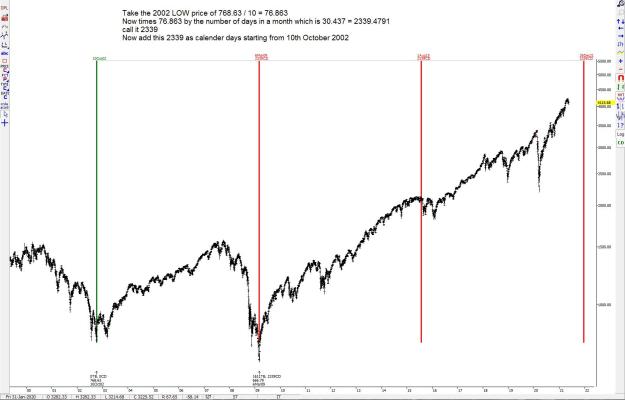
Here's one from Jenkins as the GOLD chart above but for the SP500
Moved the decimal and mentions MONTHLY - MONTHLY in Jenkins and Gann speak = SATURN
Anyway, the simple maths of messing with the numbers has returned very good turns in the SP500
(keep running the sequence!)
Attached Image (click to enlarge)
As you can see from the projection date on the chart - caught the 2022 top exceptionally well and years in advance
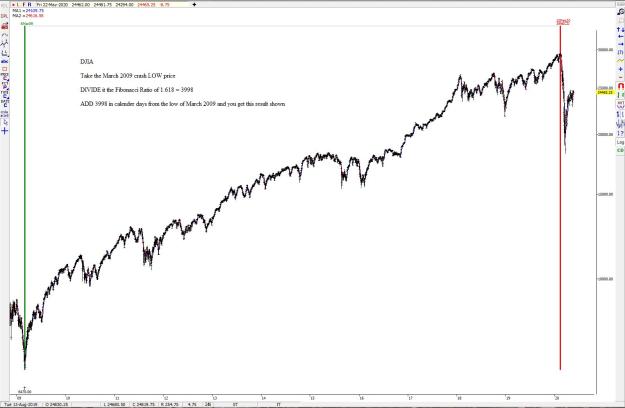
Now keeping with Jenkins theme of price and time - Here's the DJIA multiplying price low by Fib ratio and converting to TIME
This timing also coincided with on of Cowans methods from PTCT
Attached Image (click to enlarge)
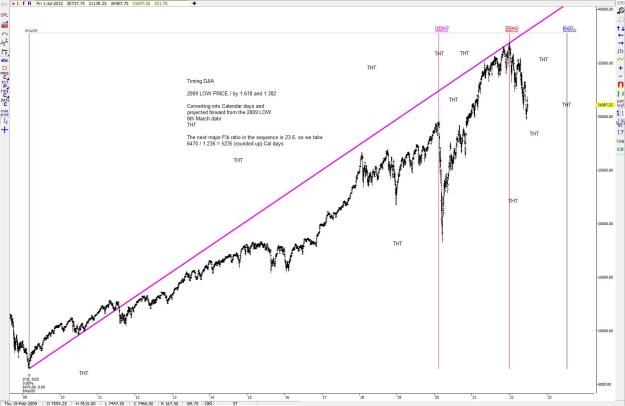
So the natural thing to do is if price and time hit using 1.618, you simply continue the sequence as shown below:
Attached Image (click to enlarge)
Now if price and time conversions work on basic months and with Fib multiplications, then they will also work off multiplications of the square roots of geometric structures like the square, cube etc
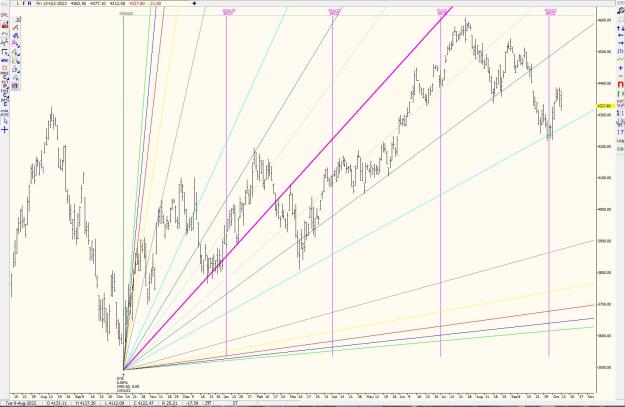
This one is right out of Jenkins Astro course where he tells you exactly what to do, whereas in his other courses he omits the Astro
This one is plotting a MERCURY trend line (very crudely - I approximated the calc below for quickness as well as rounding up Mercs H 360 cycle from 88 days to 89)
Place Mercury Helio cycle approx date from Oct 2022 LOW, then do a calc he mentions in the Astro book 2 using the LOW price, run a trend line through it, then I've taken it 1 step further myself and run Gann angles using the trend line as the 1 x 1 angle
NOTICE the 360 degs of the Merc Helio cycle interaction with PRICE and the angles! = you have loads of decent trading opportunities over the months and you can SEE this "fits" price action much better than random trend lines or gann angles
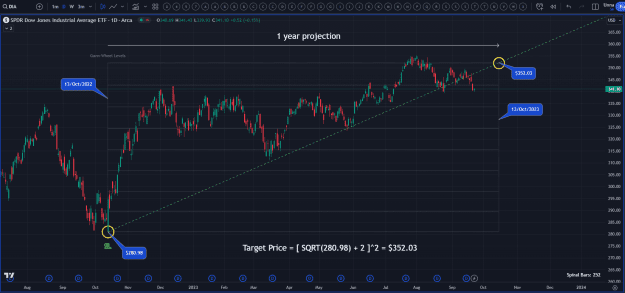
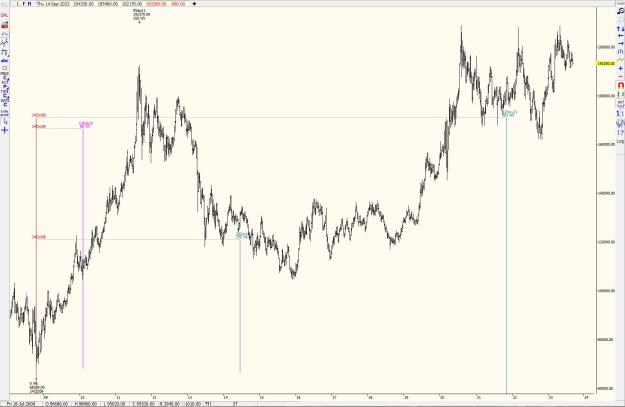
Here's one from Jenkins as the GOLD chart above but for the SP500 Moved the decimal and mentions MONTHLY - MONTHLY in Jenkins and Gann speak = SATURN Anyway, the simple maths of messing with the numbers has returned very good turns in the SP500 (keep running the sequence!) {image} As you can see from the projection date on the chart - caught the 2022 top exceptionally well and years in advance Now keeping with Jenkins theme of price and time - Here's the DJIA multiplying price low by Fib ratio and converting to TIME This timing also coincided with...
Ignored
Hmm, I just noticed your 2339 calendar days is an interesting number. You mention the monthly divisor relation to Saturn, but considering the inner planets as well:
2339 / 365.25 = 6.40383
2339 / 687 = 3.40465
2339 / 225 = 10.395
Notice approximately the same decimal afterwards.
So 2339 returns all three planets, Earth, Mars and Venus to almost the same relative separation between them - but with a 142-145 degree shift from their current locations!
So was it the Oct 2002 low that created this relationship, or was 2339 days a pre-existing cycle already running before that date? Going before that 2339 days we get May 1996, which was not a major low, but around the middle of six-month pause in the major bull market of the 1990s.
Do your homework please . NOBODY use JTTL on Forex Factory {image}
Ignored