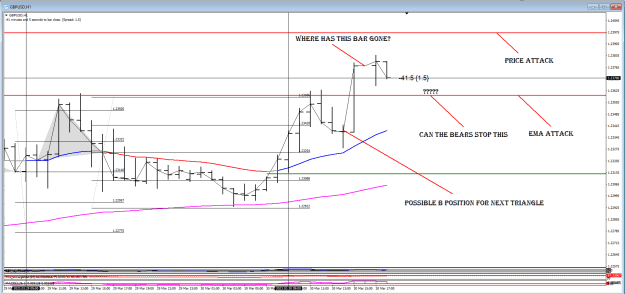
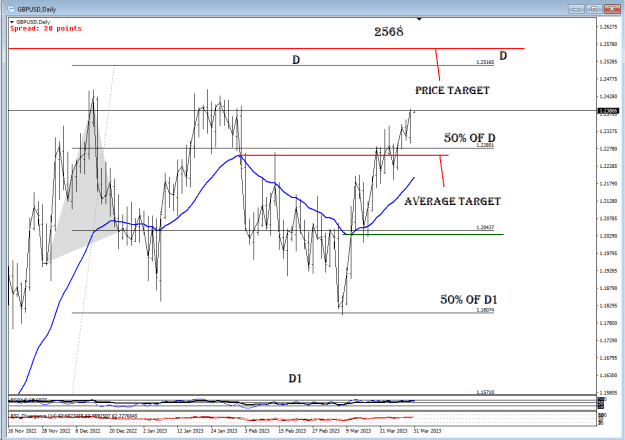
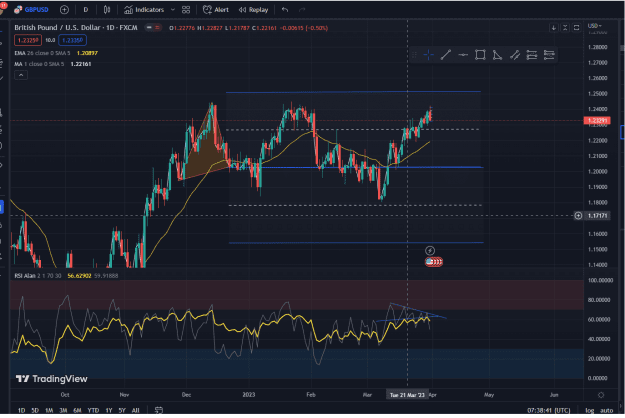
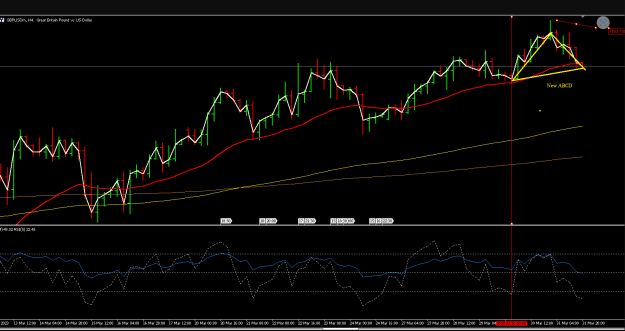
As I awake in the morning, I see the story of the hour and daily unfolding. {image} {image} Should be an interesting end to the week if these tops can be smashed.
Ignored
That bar gone nowhere, you couldn't see it bc it was same color with background (when open = close).
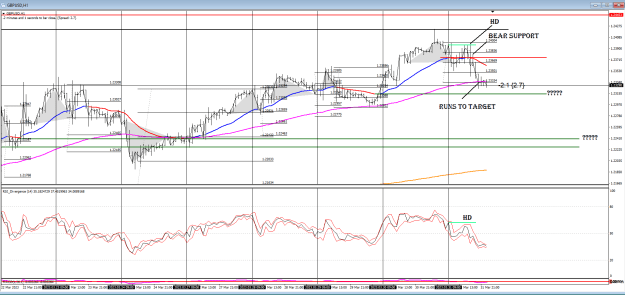
Difficult to trade the ABCD yesterday. Perhaps because it was the Friday and the last day of the month it made D1 in the final couple of hours.
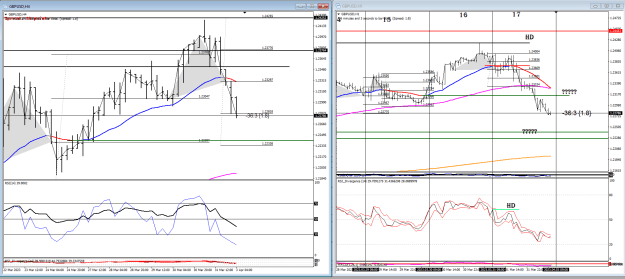
Note the HD at the top with the bears FINDING support (I was fast asleep by this time). When all said and done this was only a four-hour trade, but it took at least twice that time to set up. A long time to wait.
Now we wait to see if the bears are going to take out the LL average which they should do, but the next level for price to reach is far below which makes it doubtful.
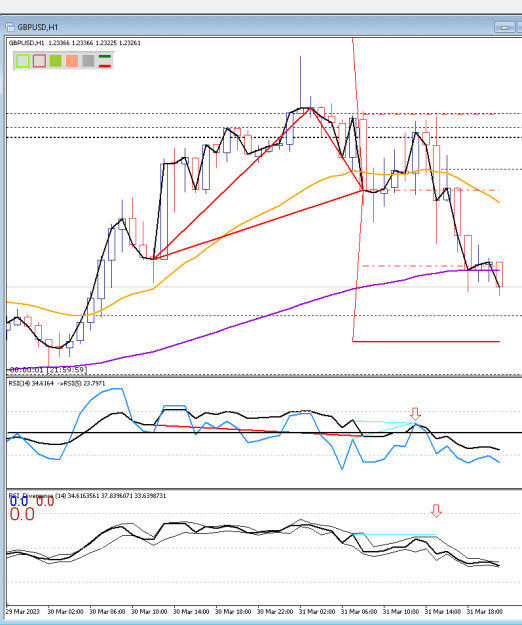
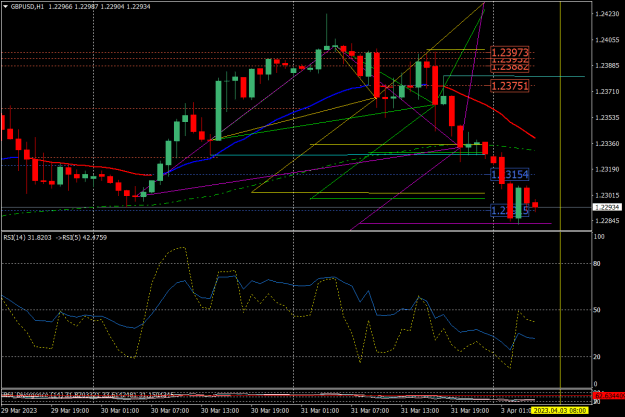
The 1H ABCD hit D1 which means The daily ABCD can't make it to the D. There's a div that gives us sell signal. Maybe the price will test the oposite side of daily ABCD?
The 1H ABCD hit D1 which means The daily ABCD can't make it to the D. There's a div that gives us sell signal. Maybe the price will test the oposite side of daily ABCD? {image} {image}
Ignored
You are correct with the RSI div however there has been several of these and none have returned the price to the EMA instead they have made HH's.
Do not assume the price cannot reach D rather watch for the failure of it to do so by the bears crossing below the EMA and FINDING support.
I look at the daily and see the EMA is still heading for a HH and need to see proof it is not going to make it.
{quote} You are correct with the RSI div however there has been several of these and none have returned the price to the EMA instead they have made HH's. Do not assume the price cannot reach D rather watch for the failure of it to do so by the bears crossing below the EMA and FINDING support. I look at the daily and see the EMA is still heading for a HH and need to see proof it is not going to make it.
Ignored
Ok. I got it but do you close long in this case because of the div? If you don't till the price cross below ema and find support maybe it's too late for exit? Do you use price action for early entry/exit?
{quote} When trading these triangles there is no need for 3 entries just set the profit to 2% and the stop to 1%.
Ignored
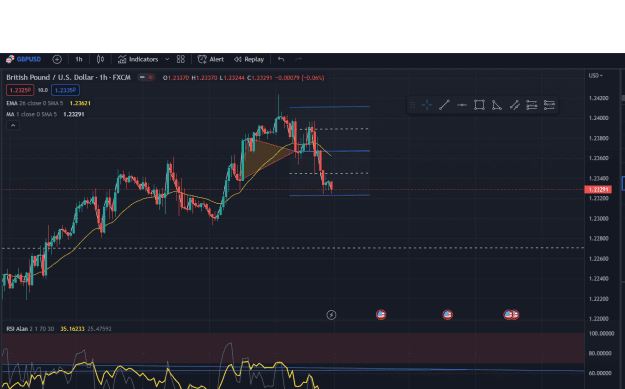
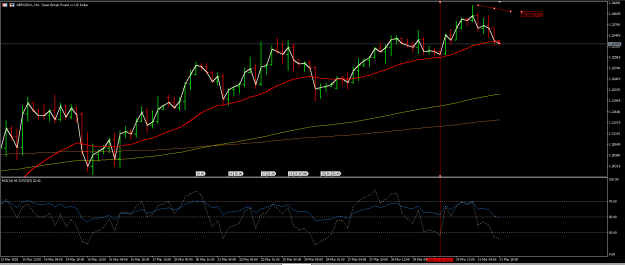
I followed through your analyses till this point and got stuck in finding the next target that price heading to (assuming that now we are now at 2023.03.30) and the price just hited the EMA target on H4. How can we draw the next target (which I point - this target) on the picture?
{quote} Ok. I got it but do you close long in this case because of the div? If you don't till the price cross below ema and find support maybe it's too late for exit? Do you use price action for early entry/exit?
Ignored
I don't use the daily for setups at all because they take weeks to execute. It doesn't matter when you enter it can still easily go a hundred peips against you even if you are right. That hundred pips could be in my pocket using a lower time frame.
{quote} I followed through your analyses till this point and got stuck in finding the next target that price heading to (assuming that now we are now at 2023.03.30) and the price just hited the EMA target on H4. How can we draw the next target (which I point - this target) on the picture? {image}
Ignored
A new ABCD has formed there.
The bears have not yet FOUND support so we don't yet know if this up move will continue or will the bears roll it over from here.
{quote} I don't use the daily for setups at all because they take weeks to execute. It doesn't matter when you enter it can still easily go a hundred peips against you even if you are right. That hundred pips could be in my pocket using a lower time frame.
Ignored
As far as I understand, you use daily just for following the trend, you don't keep a trade open till it reaches the daily target? What if we keep it open till daily target gets hit? It's no lose trade if we move SL to breakeven. Meanwhile we still open other trades for profit
{quote} As far as I understand, you use daily just for following the trend, you don't keep a trade open till it reaches the daily target? What if we keep it open till daily target gets hit? It's no lose trade if we move SL to breakeven. Meanwhile we still open other trades for profit
Ignored
Sure, you can do that, and I am not suggesting you don't. The trade on the daily chart would only require a small lot size for the number of pips it makes over time and this may indeed benefit those who cannot attend their charts for whatever reason.
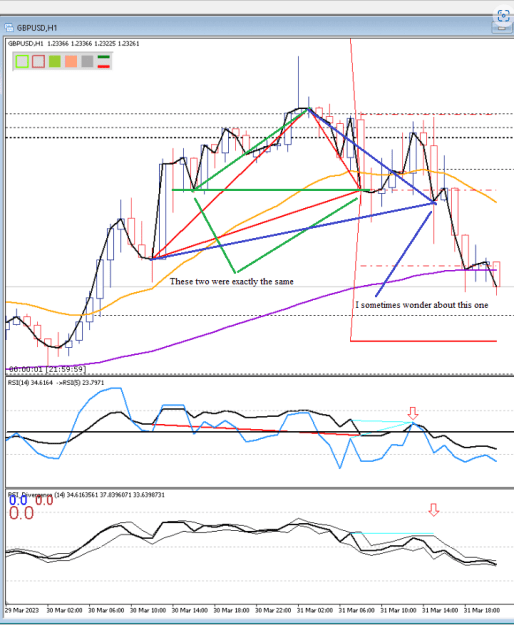
Alan may not like this ABCD as BC is on same side, but i think this ABCD hold price rather good. EMA seem trying to find LL on H1, but on daily, it try to find HH. Still, with those inference I have short bias, let's see if there are more information appear before bar 108 then.
{image} Alan may not like this ABCD as BC is on same side, but i think this ABCD hold price rather good. EMA seem trying to find LL on H1, but on daily, it try to find HH. Still, with those inference I have short bias, let's see if there are more information appear before bar 108 then.
Ignored
Well if you had the 4 hour EMA on your hour chart you would see they are on opposite sides. (4 hour EMA is a 104 period on the hour)