I think its time that I reposted what I said back in August 2020 post # 5,981 top of Page 300:....
"OK, This is what I wanted to post at the top of this page....loads of detail on my thought process, research etc etc. I hope it helps some traders, and answers many of the repeated questions
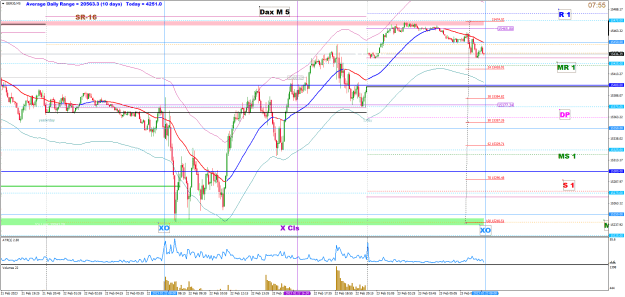
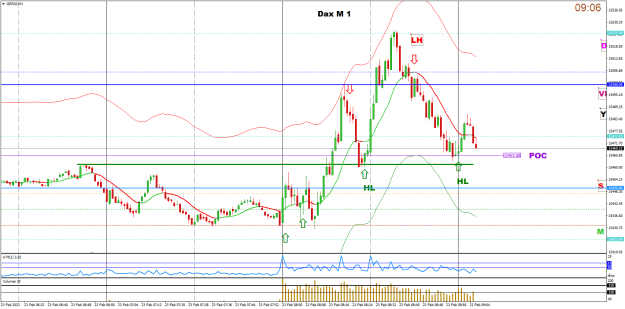
So a couple of years ago I took a look at the then newish contract for Dax that FXCM had recently added and was impressed by its intra-day swings during the open hours of the Cash Market – 9.00am until 5.35pm in my time zone.
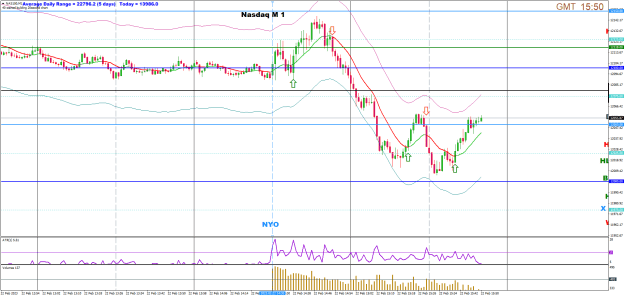
I then looked at a few charts on the M 1 time frame because I wanted as much information as possible if I was going to trade its intra-day swings. Forget trading off M5 or M15.
I decided that analysing any swing that was 50 pts or larger from its high to its low was the way to go as it was reasonable to expect to bank at least 30 pts from any such move, allowing for delay on entry, spread, slippage etc both on entry & exit
Thus I looked at a year’s data on M 1 charts, plotting each 50+ swing hour by hour, inputting the minute the swing started, its price, the minute it ended and the price, then the minutes in the swing and the total pts move. 260 days with 10 hours of data each day – 8am to 6pm
I did some into a notebook and some into an Excel spreadsheet and it was a very worth- while exercise, giving me an excellent knowledge of the internal moves of the Dax Cash Index, both in price and time
I was then able to look at these moves from a VSA perspective – the theory of Volume Spread Analysis as invented by the late Tom Williams, who used it when he lived as a trader in the USA, trading equities. When he returned to Brighton in the UK I visited him and spent a day with him as he explained this theory, which uses the volume of a bar and its spread (range) usually on the 15m or higher time frame as a method of watching for the actions of the Big Boys – aka Smart Money (SM) as they enter and exit the market.
The SM moves price and we retail traders are like flies on the back of the Elephant SM Traders – just along for the ride. VSA helps us to see their Elephantine foot prints and hopefully ride on their moves.
I use Japanese Candlesticks as, IMO, these are the best way of seeing the Price Action in each bar – its easier to type bar, but I mean Candlestick!
A few thousands of hours of studying the charts in real time will help with deciding how to usefully employ this theory and combining it with other inputs such as Levels and Time.
It is up to the individual trader to decide what levels to have on his chart – some prior Highs & Lows, aka Fractals are a basic, as are some fixed levels aka Sweet Spots like the 00s aka the Big Round Numbers – BRN, and some smaller ones maybe, the 50s or 25s.
Then there are the Daily Pivots as used hundreds of years ago by the Chinese Rice Traders in Osaka. They are based on yesterday’s High, Low and Close and put into a simple formula that, before the age of computers, were calculated by hand and written on a piece of paper which would be found in every trader’s pocket. I use the SDX-TzPivots indicator with the Dest Time = 2 as I have done for a long time. They are clearer on a dark background chart, but I am used to a white background, a hangover from printing out hundreds of charts for manual analysis and comparison.
manual analysis and comparison.
Then I add the standard MT 4 volumes and also the ATR set to 1 to show a histogram of each bar’s range – neither of these are “indicators”, they are just showing unmodified data., such data being the basis of VSA analysis.
This gives me the basics that I need to “see” the PA and make my trading decisions.
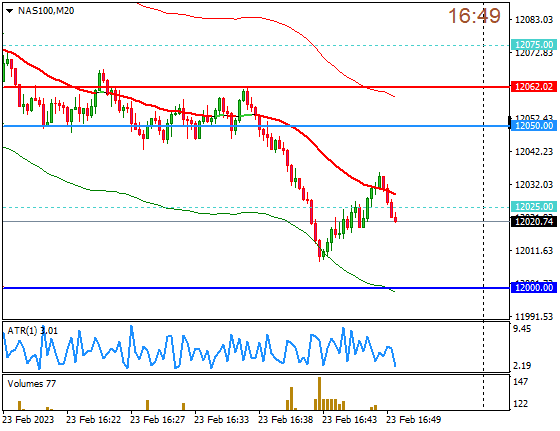
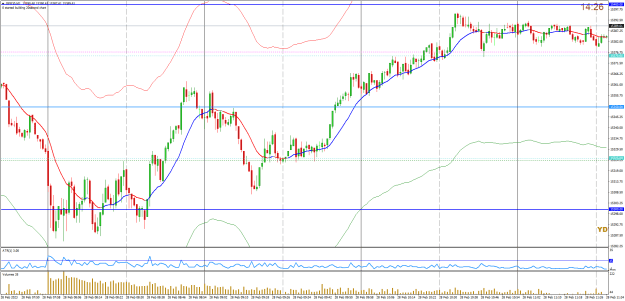
As a guide for retracements I have added a Moving Average – currently a 50 period LWMA 50, its not fixed in stone and its just a guide. Recently, I added the standard MT 4 Envelope as a simple visual guide to when price is becoming extended from its mean returning MA.
Both of these can be used to make part of a simple KISS set of Trading Rules which may help the less experienced traders.
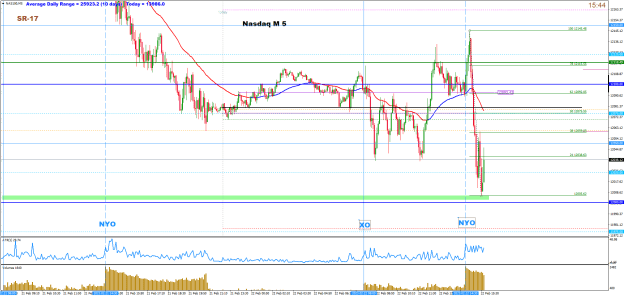
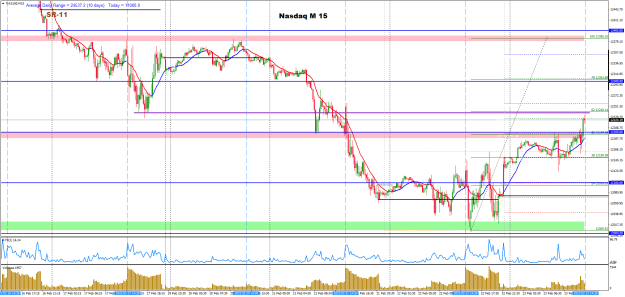
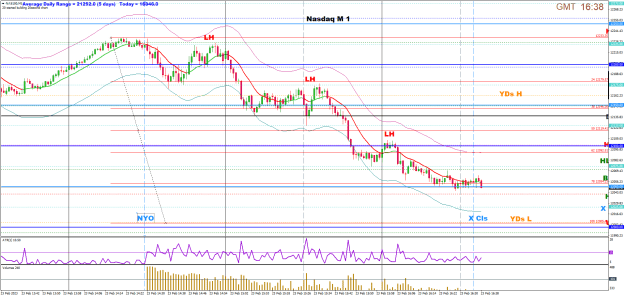
So that’s what I use on my M 1 charts. I also have M 5 charts for both the S&P, Nas and Dax open side by side in another monitor and they have less levels etc and I will usually put on the Fibonacci Retracements for yesterday’s range to allow for easy comparison of moves.
Most of the time, last Thursday being an exception, the action in the US Indices drives the other Indices, even in the European mornings and thus they are worth watching. In the afternoon I prefer to trade one of them rather than the Dax.
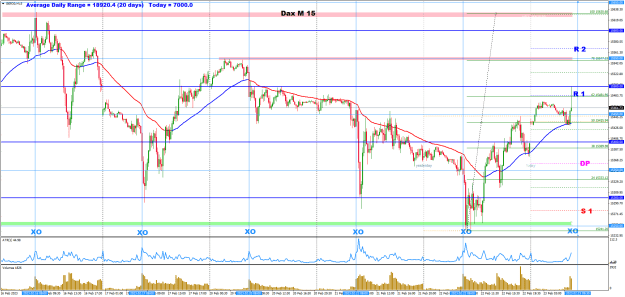
I start my day before the old Excel Open – aka Frankfurt Open for FX Traders – by reviewing my M60 charts before dropping to M5, putting on Fibs etc
To trade any instrument Intra-Day requires a lot of hard work and research before there is any possibility of becoming profitable – and that’s without the actual problem that come with trading off the right of the screen with your own real money.
For newbies I would always advise you to divide your capital into at minimum 4 and only put 1 portion with your broker so that when you loose it – which you will – you can start again.
When you are happy with trading off the M 1 chart, you might consider adding a 20 seconds chart as this can help you sharpen your entries and which is probably the reason that sometimes I can enter at what may be the H or L of a move on M1. It’s a bit stressful, but so rewarding when it works!
OK some charts will follow when I have time and please remember, these will always be after the events. I have posted in real time before – the last time was last summer – I quickly found 50+ lurkers using me as a signal service, so I stopped posting.
Likewise I will answer questions as my time allows."
"OK, This is what I wanted to post at the top of this page....loads of detail on my thought process, research etc etc. I hope it helps some traders, and answers many of the repeated questions
So a couple of years ago I took a look at the then newish contract for Dax that FXCM had recently added and was impressed by its intra-day swings during the open hours of the Cash Market – 9.00am until 5.35pm in my time zone.
I then looked at a few charts on the M 1 time frame because I wanted as much information as possible if I was going to trade its intra-day swings. Forget trading off M5 or M15.
I decided that analysing any swing that was 50 pts or larger from its high to its low was the way to go as it was reasonable to expect to bank at least 30 pts from any such move, allowing for delay on entry, spread, slippage etc both on entry & exit
Thus I looked at a year’s data on M 1 charts, plotting each 50+ swing hour by hour, inputting the minute the swing started, its price, the minute it ended and the price, then the minutes in the swing and the total pts move. 260 days with 10 hours of data each day – 8am to 6pm
I did some into a notebook and some into an Excel spreadsheet and it was a very worth- while exercise, giving me an excellent knowledge of the internal moves of the Dax Cash Index, both in price and time
I was then able to look at these moves from a VSA perspective – the theory of Volume Spread Analysis as invented by the late Tom Williams, who used it when he lived as a trader in the USA, trading equities. When he returned to Brighton in the UK I visited him and spent a day with him as he explained this theory, which uses the volume of a bar and its spread (range) usually on the 15m or higher time frame as a method of watching for the actions of the Big Boys – aka Smart Money (SM) as they enter and exit the market.
The SM moves price and we retail traders are like flies on the back of the Elephant SM Traders – just along for the ride. VSA helps us to see their Elephantine foot prints and hopefully ride on their moves.
I use Japanese Candlesticks as, IMO, these are the best way of seeing the Price Action in each bar – its easier to type bar, but I mean Candlestick!
A few thousands of hours of studying the charts in real time will help with deciding how to usefully employ this theory and combining it with other inputs such as Levels and Time.
It is up to the individual trader to decide what levels to have on his chart – some prior Highs & Lows, aka Fractals are a basic, as are some fixed levels aka Sweet Spots like the 00s aka the Big Round Numbers – BRN, and some smaller ones maybe, the 50s or 25s.
Then there are the Daily Pivots as used hundreds of years ago by the Chinese Rice Traders in Osaka. They are based on yesterday’s High, Low and Close and put into a simple formula that, before the age of computers, were calculated by hand and written on a piece of paper which would be found in every trader’s pocket. I use the SDX-TzPivots indicator with the Dest Time = 2 as I have done for a long time. They are clearer on a dark background chart, but I am used to a white background, a hangover from printing out hundreds of charts for manual analysis and comparison.
manual analysis and comparison.
Then I add the standard MT 4 volumes and also the ATR set to 1 to show a histogram of each bar’s range – neither of these are “indicators”, they are just showing unmodified data., such data being the basis of VSA analysis.
This gives me the basics that I need to “see” the PA and make my trading decisions.
As a guide for retracements I have added a Moving Average – currently a 50 period LWMA 50, its not fixed in stone and its just a guide. Recently, I added the standard MT 4 Envelope as a simple visual guide to when price is becoming extended from its mean returning MA.
Both of these can be used to make part of a simple KISS set of Trading Rules which may help the less experienced traders.
So that’s what I use on my M 1 charts. I also have M 5 charts for both the S&P, Nas and Dax open side by side in another monitor and they have less levels etc and I will usually put on the Fibonacci Retracements for yesterday’s range to allow for easy comparison of moves.
Most of the time, last Thursday being an exception, the action in the US Indices drives the other Indices, even in the European mornings and thus they are worth watching. In the afternoon I prefer to trade one of them rather than the Dax.
I start my day before the old Excel Open – aka Frankfurt Open for FX Traders – by reviewing my M60 charts before dropping to M5, putting on Fibs etc
To trade any instrument Intra-Day requires a lot of hard work and research before there is any possibility of becoming profitable – and that’s without the actual problem that come with trading off the right of the screen with your own real money.
For newbies I would always advise you to divide your capital into at minimum 4 and only put 1 portion with your broker so that when you loose it – which you will – you can start again.
When you are happy with trading off the M 1 chart, you might consider adding a 20 seconds chart as this can help you sharpen your entries and which is probably the reason that sometimes I can enter at what may be the H or L of a move on M1. It’s a bit stressful, but so rewarding when it works!
OK some charts will follow when I have time and please remember, these will always be after the events. I have posted in real time before – the last time was last summer – I quickly found 50+ lurkers using me as a signal service, so I stopped posting.
Likewise I will answer questions as my time allows."
Trading Levels with WRBs
5