If I don't mention SL and/or TP = longer-term setup possibly in the works!
- #166,782
- Jan 30, 2023 11:35am Jan 30, 2023 11:35am
- Joined Sep 2016 | Status: Its my job to know what others dont | 1,348 Posts
WaBaS Where are Buyers and Sellers
- #166,784
- Jan 30, 2023 11:55am Jan 30, 2023 11:55am
- Joined Sep 2020 | Status: Trader | 8,702 Posts
If I don't mention SL and/or TP = longer-term setup possibly in the works!
- #166,785
- Jan 30, 2023 11:57am Jan 30, 2023 11:57am
- Joined May 2014 | Status: Full Time Trader | 27,335 Posts | Online Now
Focus only on what truly matters!
- #166,786
- Jan 30, 2023 12:03pm Jan 30, 2023 12:03pm
- Joined Sep 2020 | Status: Trader | 8,702 Posts
If I don't mention SL and/or TP = longer-term setup possibly in the works!
- #166,788
- Jan 30, 2023 12:05pm Jan 30, 2023 12:05pm
- Joined Apr 2011 | Status: Liverpool's KOP | 8,062 Posts
Patience, Emotion Control and Discipline.
- #166,790
- Jan 30, 2023 12:16pm Jan 30, 2023 12:16pm
- Joined Sep 2020 | Status: Trader | 8,702 Posts
If I don't mention SL and/or TP = longer-term setup possibly in the works!
- #166,791
- Jan 30, 2023 12:17pm Jan 30, 2023 12:17pm
- Joined Sep 2020 | Status: Trader | 8,702 Posts
If I don't mention SL and/or TP = longer-term setup possibly in the works!
- #166,792
- Jan 30, 2023 12:24pm Jan 30, 2023 12:24pm
- Joined Sep 2020 | Status: Trader | 8,702 Posts
If I don't mention SL and/or TP = longer-term setup possibly in the works!
- #166,795
- Jan 30, 2023 1:01pm Jan 30, 2023 1:01pm
- Joined Sep 2020 | Status: Trader | 8,702 Posts
If I don't mention SL and/or TP = longer-term setup possibly in the works!
- #166,796
- Jan 30, 2023 1:07pm Jan 30, 2023 1:07pm
- Joined Sep 2020 | Status: Trader | 8,702 Posts

If I don't mention SL and/or TP = longer-term setup possibly in the works!
- #166,797
- Jan 30, 2023 1:13pm Jan 30, 2023 1:13pm
- Joined Sep 2020 | Status: Trader | 8,702 Posts
If I don't mention SL and/or TP = longer-term setup possibly in the works!
- #166,799
- Jan 30, 2023 1:17pm Jan 30, 2023 1:17pm
- Joined Sep 2020 | Status: Trader | 8,702 Posts
If I don't mention SL and/or TP = longer-term setup possibly in the works!
- #166,800
- Jan 30, 2023 1:18pm Jan 30, 2023 1:18pm
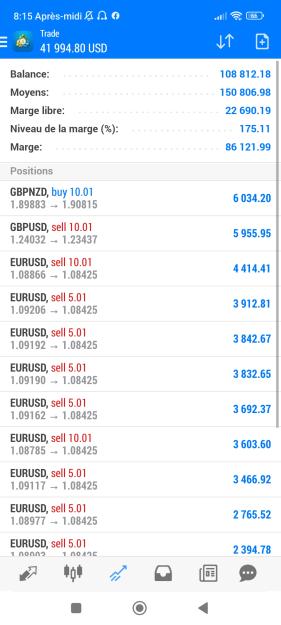
REDA_EL_HARAOUI
ELITE MOROCCO SNIPER All Time Return:
27.5%