Disliked{quote} LOL! With great difficulty. I am constantly tinkering and messing things up to my own deteriment. I thought automation would fix this but it's clearly a flaw in my personality. That's one reason I post here so often; at least it keeps me busy and slows down my 'interference rate'.Ignored
Similar Threads
Day Trading vs. Swing Trading vs. Position Trading 86 replies
 Clemmo's Trading Odyssey
- #401
- Jan 13, 2023 5:27am Jan 13, 2023 5:27am
- Joined Dec 2010 | Status: Foook Bollinger-dr.Kegel knows! | 9,794 Posts
- #402
- Jan 14, 2023 12:04pm Jan 14, 2023 12:04pm
- Joined Jul 2016 | Status: Trader | 2,534 Posts
Bandsaw
Remember, Jackanape? No, of course not, even I don't remember it and that was just a few days ago.
But, but but - it became the basis for a whole new category of systems. I was intrigued by the 'rising floor', 'falling ceiling' idea of higher highs/lower lows and I wondered if it would be improved by mashing it together with some cyclical theory because I was still deeply ensconced in the first thing I ever learned about. When you're a noob with just a hammer, everything looks like a nail.
What you end up with is a circular sine wave (the saw blade) and a channel/renko block (the bands) hence a 'bandsaw'. I know, weird.
VIEWER DISCRETION
What follows is completely nuts. But you're probably getting used to it.
An evolution and simplification (Oh Goodness, no) of Jackanape. One that takes advantage of two of the surest ‘edges’ I have yet found, namely, the tendency for price to reverse at a band’s edge, (reversion) and for price to reverse at the end of a cycle (not so sure at all). Like the twin wheels of a bandsaw, the M5 and M15 cycles propel the flexible toothed TMA band as it cuts through pips!
When used in unison the preliminary backtesting I did provided breath-takingly suspiciously good results (92%+ win rate). Of course, we’ve been down this path rabbit-hole before, so don’t get your hopes up (too late). (Those TMA bands make everything look good, fool!)
One factor that might give pause is that both the bands, and the Goertzel filter are recalculating low-down lying rascals. (so ditch them!) So any good results might simply be the ability of G to conform, snake-like, to the twists of past history, and the bands to conveniently hit price targets as they rebound. However, it seems unlikely that G could do this going back as far as 4000 bars, using a single cycle (?) (hahaha, oh, Sweet Summer Child) Also, cycles are, after all, the drivers of price if we can believe Hurst et al. So, seeing some correlation to price turns at cycle turns isn’t too much of a stretch.
Speaking of stretch, the bands are somewhat elastic, but they don’t recalculate as much as they tend to get (undeserved) credit for, and the signals don’t repaint (I think) at all, so if good entries are matching up with new cycle phases that would seem to be cause for optimism.
Another aspect that I like about this strategy is there is no judgment or calculation of band turns (or anything else) that needs to be applied to every trading decision. You simply observe the approaching or recently past cycle change, coinciding with a band break (and corresponding signal) then enter as specified. This makes it basket-tradeable, maybe even automatable.
Every trade has a clear objective (other side of its band), a clear timeline (before cycle changes) and the only artistry required is choosing the amount of G history, and combination of cycles to use to match price at each chosen trading horizon.
Instruments: Any
Timeframes: M5 (using M5 and M15 in mtf indicators).
Why M5? Good resolution and, more importantly, we need trades to complete in a reasonable amount of time. The M5 band, set to a moderately high period offers trades that usually complete in ~1 day (24h) or less. The M15 band, usually completes trades in ~1 week or less. Tempting to try M1 but I suspect the cycles are too unstable. Maybe as a future experiment.
Indicators:
Attached Image (click to enlarge)
Remember, Jackanape? No, of course not, even I don't remember it and that was just a few days ago.
But, but but - it became the basis for a whole new category of systems. I was intrigued by the 'rising floor', 'falling ceiling' idea of higher highs/lower lows and I wondered if it would be improved by mashing it together with some cyclical theory because I was still deeply ensconced in the first thing I ever learned about. When you're a noob with just a hammer, everything looks like a nail.
What you end up with is a circular sine wave (the saw blade) and a channel/renko block (the bands) hence a 'bandsaw'. I know, weird.
VIEWER DISCRETION
What follows is completely nuts. But you're probably getting used to it.
An evolution and simplification (Oh Goodness, no) of Jackanape. One that takes advantage of two of the surest ‘edges’ I have yet found, namely, the tendency for price to reverse at a band’s edge, (reversion) and for price to reverse at the end of a cycle (not so sure at all). Like the twin wheels of a bandsaw, the M5 and M15 cycles propel the flexible toothed TMA band as it cuts through pips!
When used in unison the preliminary backtesting I did provided breath-takingly suspiciously good results (92%+ win rate). Of course, we’ve been down this path rabbit-hole before, so don’t get your hopes up (too late). (Those TMA bands make everything look good, fool!)
One factor that might give pause is that both the bands, and the Goertzel filter are recalculating low-down lying rascals. (so ditch them!) So any good results might simply be the ability of G to conform, snake-like, to the twists of past history, and the bands to conveniently hit price targets as they rebound. However, it seems unlikely that G could do this going back as far as 4000 bars, using a single cycle (?) (hahaha, oh, Sweet Summer Child) Also, cycles are, after all, the drivers of price if we can believe Hurst et al. So, seeing some correlation to price turns at cycle turns isn’t too much of a stretch.
Speaking of stretch, the bands are somewhat elastic, but they don’t recalculate as much as they tend to get (undeserved) credit for, and the signals don’t repaint (I think) at all, so if good entries are matching up with new cycle phases that would seem to be cause for optimism.
Another aspect that I like about this strategy is there is no judgment or calculation of band turns (or anything else) that needs to be applied to every trading decision. You simply observe the approaching or recently past cycle change, coinciding with a band break (and corresponding signal) then enter as specified. This makes it basket-tradeable, maybe even automatable.
Every trade has a clear objective (other side of its band), a clear timeline (before cycle changes) and the only artistry required is choosing the amount of G history, and combination of cycles to use to match price at each chosen trading horizon.
Instruments: Any
Timeframes: M5 (using M5 and M15 in mtf indicators).
Why M5? Good resolution and, more importantly, we need trades to complete in a reasonable amount of time. The M5 band, set to a moderately high period offers trades that usually complete in ~1 day (24h) or less. The M15 band, usually completes trades in ~1 week or less. Tempting to try M1 but I suspect the cycles are too unstable. Maybe as a future experiment.
Indicators:
- Forex-TSD’s Goertzel browser (my mod of) now named CycleSeeker. I’ve modded it to retain the most used settings. Use two instances in one chart -one using M5 tf and the other M15. This is very CPU intensive, alas, so you will only be able to work on one chart per MT4 instance. Even then, over time, you may need to restart MT4 when it chugs.
- TF: one M5 and one M15
- Price:0; HPsmooth:20;ZLMsmooth:10;BarsToCalc:1 } I currently see no reason to change these, ever.
- StartAtCycle
 1-3 approx). Usually you’ll start with the first cycle which is the dominant one. However, if that cycle is very large (say over 1100-1200ish), it will flatten your graph to the point of meaninglessness, and stretch it out past your trading horizon. Better to keep in mind the direction that’s showing you, and use lower (shorter) cycles to make decisions within your horizon. Rarely will you need to go lower than 2 (the second cycle) but occasionally you will have 2 huge dominant cycles. This also depends on how many past bars you’re using. See the section on WindowSizePast.
 - UseTopCycles1-10 approx). Here is the real discretionary setting. If you simply use one top cycle it gives you a nice clear sine wave. However precision may be improved by blending this with the cycle below it, especially if that lower cycle’s CySt is high relative to the other cycles. Two cycles often gives a nicely modulated sine wave that mimics price close enough without trying to overthink it.
What do I mean by overthinking it? If you use too many topCycles, you get a complex wave that often closely approximates past history. It has led me to think that the future wave is a good approximation of what price will do in the future. The horrible thing is sometimes it is! Sometimes it is so accurate you think you’ve got a crystal ball, and then just when you make an important trading choice, it goes completely wrong. Much like the devil’s use of occasional truths to better ensnare his victims, G will sometimes give you accurate glimpses of the actual price action but I can’t emphasize this enough. It is a liar! DON’T TRUST IT. (completely) It recalculates ceaselessly, and what it shows you one minute could differ significantly the next. (get behind me Satan!)
For this reason, it is better to use a much abstracted ‘hint’ of the future price direction (the sine wave or blended wave) by not using more than 1,2, 3, maybe 4 topCycles. Sometimes you will get an instrument on a timeframe that doesn’t have a clear dominant wave, and has many cycles all sharing similar periods and CySt. In that case you may have no choice but to blend together around 7-8, maybe more topCycles. Still if the wave looks crazy and the buy/sell colors are ‘scattered’ go back to fewer topCycles.
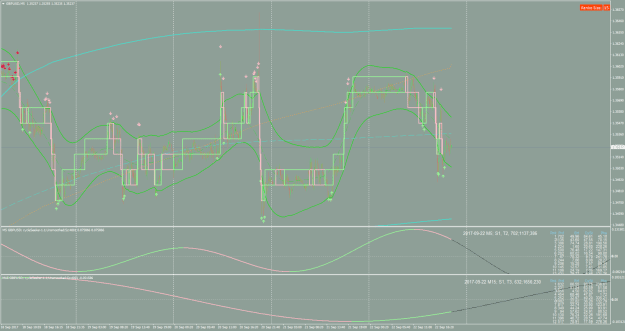
Fig 1. & 2 showing good followed by bad graph examples.
Attached Image (click to enlarge)
Fig.1 - Good example
M5 cycle is a blended sine wave, each buy/sell period is just over a day. M15 is a single cycle wave with each buy/sell phase around 3 days, a little short, but if we switch to the 3rd cycle which has a longer period, each phase becomes about 12 days, which is a little long. If we blend it with cycle 2, the wave becomes much too short, similar to M5. So, make a judgment based on past history.
I’d probably stick with the slightly short M15 wave using the dominant cycle alone. OR I’d use the cycle list (see Cycle list section) and pick cycles 1 and 3 (skipping 2) giving a blend of cycle 2’s overly long 1656 period with 1’s somewhat short 632 period. That gives us a wave almost exactly a week long. The key is to compare this wave with past band signals to see if it makes sense. Note that short cycle 2 (period 230) used to be in third position as noted by the indicator sub-window label but has shifted to second position, so a list is the only way to blend 1&3.
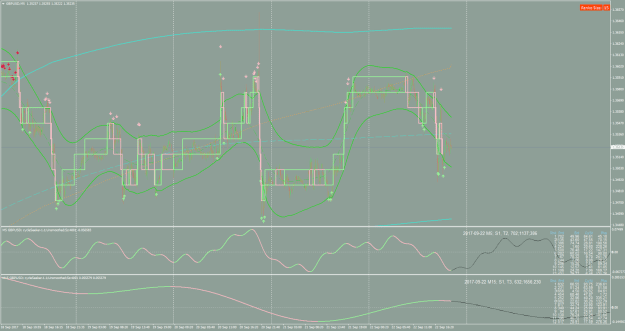
Attached Image (click to enlarge)
Fig. 2 - Example of some ‘bad’ cycle waves / bad cycle choices
M5 wave is jittery, with choppy sections of buy/sell, because it’s using too many topCycles, although we can still discern the larger wave pattern behind it, so strong is the dominant wave. M15 wave phases are too short - use the top cycle by itself instead of the top 3. - UseCosineForWaves:true; UseAdditionForSteps:false; UseSquaredAmp:true } don’t change these. You can mess with them as experiments but my limited understanding of the Goertzel equation is that these are set to how it’s supposed to be done. If there was an advantage to changing them, I think they’d already have been set by default.
- MaxCycLength: (400-2000 approx.) The higher the value, the longer the cycle length the filter will let through. Longer cycles give you a better idea of the overall trend, but a worse idea of near-future twists and turns. It’s a bit like the Heisenberg uncertainty principle. You can either see a clear picture of the future trend direction, but be unsure about WHEN it will start, or you can see when price will immediately move (rise or drop) but be unsure about the overall direction; (of course, after Ehlers, I might realize that trying to predict the overall trend (spectral dilation) is foolhardy and to settle for smaller periods) you can’t have both. Of course you can try a shorter setting, sceencap the graph, then try a longer setting, screencap that graph, and then imagine/draw/plot what these would look like blended. If you know something about Hurst’s theories you know that price action is just cycles blended together, the longer cycles providing the overall trend directions, while the shorter cycles twist and turn along the path of the longer trend. The G graph does its best to give you an idea of the composite wave, but as I mentioned, it’s a mirror of Erised (Harry Potter) showing you what you want to see, not what will happen.
Note that the longer this value is, the harder your CPU will work so I don’t recommend much over 2000 especially with two filters in one chart as we’re doing. Overly long cycles will flatten the graph to meaninglessness, overly short ones will give you a bouncy meaningless mess. You have to try to find the signal in the noise by arriving at the happiest median. More art than science, for now.
Also note this value as a product with BartNoCycles must be < WindowSizePast. In other words, if BartNoCycles = 2 and MaxCycleLengh is 2000, then WindowSizePast must be at least 4001 or you’ll get a subtle error message. - SubtractNoise: false } ironically this seems to make the graph noisier when set to true, so I’m not really sure what it’s purpose might be/have been. Doesn’t seem useful.
- Interpolate: true } no reason to change
- WindowSizePast. (1000-4000 approx) The higher the value the more bars the filter will use to find cycles, the harder your CPU will work, and the higher the potential cycle length can be. Note that WindowSizePast must exceed the value of MaxCycleLength / BartNoCycles) by at least one, otherwise you’ll get a very subtle error message in the top left corner and nothing might show up on the chart. In practice I don’t go over 4001, for CPU sanity, but I like to have the option of seeking the highest possible cycles even if I end up excluding them in the TopCycles option.
- WindowSizeFuture: 600-800. The distance that the future line is extrapolated. I like this to be as long as possible; it doesn’t seem to affect CPU. Past 800 it goes off the screen on my 1680x1050 monitor.
- FutureLineDisplace: 0; PredictionVisible: true; ListofCyclesVisible: true; Multicolor: true } can’t see a reason to change any of these
- UseCycleList: false. Keep this false unless you want to blend together a few cycles that are separated by others in the Rnk. In that case just set it to true and put the Rnk # of the cycles you want to use in the appropriate slots. This will then override what you set in StartAtCycle and UseTopCycles.
- DetrendSmoothData: false } Doesn’t improve anything, in fact makes everything a mess. This could be experimented with further but I’ve never got anything from it, despite reading that data should always be detrended before extracting cycles.
- DTMethod settings: unimportant as we’re leaving the data trended and unsmoothed
- UseCycleStrength: true; you could try turning this off in which case it uses amplitude,I think? Doesn’t seem to help.
- FilterBartels: false; I don’t find that Bartels filtering helps with anything, but it’s hard to prove or verify. I’ve done lots of experimentation; my gut instinct is that it’s better left off.
- BartNoCycles. By default this is supposed to be 5. The Goertzel filter is supposed to have at least 3 cycles to verify cycle significance. I find, however, that any degree of filtering through these cycles produces a smoothed out mess. Setting this to 1 and then using a high number of TopCycles actually produces a very close approximation of past history and a very seductive (but deceptive!) future line. Altering this value produces vastly different waves, and despite much experimentation it’s still an open question about what setting this should be. Note the relationship between this setting and MaxCycLength and WindowSizePast. The higher the value here the more bars will be needed in WindowSizePast. For this reason, it’s not really practical to go higher than 5 but I’ve gone as high as 11 using short MaxCycleLength(with interesting results). Setting this to 1 basically turns filtering off, and you’ll get the same Brt rating for every cycle, making selection by Bartels significance impossible. If there’s one question that future experiments need to answer with this system, it is, what BartNoCycles setting gives the best results with BandSaw? My gut is that this should be lower than 5. Maybe higher than 1, so we can see the Brt ranking when choosing cycles, and so that the cycles selected have a good Bartels significance. At the time of writing (September 2017) I’m using 2. As with everything else, check the resultant wave that your settings produce with the actual past price history and the coincidence of band signals. See what happened when a band signal was produced. If you get near 85-100% success when you use the cycle phase as a filter for those signals then you know as much as I do.
- BartSmoothPer: 2; Seems to do little except make the Rnkings freak out if set to 0.
- SortBartels: false; if FilterBartels is false then this will do nothing. If both are set to true, it will use the Bartels significance score (Brt) to sort the cycle rankings instead of CycleStrength. This can be interesting, but often the most significant cycles according to Bart are the shorter period ones, and a single short period wave will not work with our trading horizon; a number of blended short ones just produces a chaotic mess. If one or two of the top Brt cycles is about the right length, it is worth trying to set it/them as the lone top cycle(s) to see what kind of wave it produces. Again, as, always, with everything, compare that wave to past price action to see if it’s a good fit. That’s all I know for now. If this system works half as well in live testing as the limited backtesting I’ve been able to do, then even a few wonky cycles shouldn’t hinder it too much. (??)
- TMAdCGmladen-arrowsMod - my small adapation of the centered TMA bands whose exact origins are still unclear. Mladen says these things don’t produce signals that are worth anything but I highly disagree; I even wonder if he wasn’t throwing a red herring to avoid drawing too much attention to them. Modifying the signals on these so that they ignore band breaks that are not contravening the order logic (see Jackanape) might still be worthwhile but doesn’t seem to be as important with this system. Modifying it so that signals that contravene the cycle phases will be suppressed is also of interest, but it would need to be a fuzzy limit since early and late (relative to the cycle) band signals are still vital to the system’s success. A human can make these kinds of distinctions easily. An arbitrary percentage range across the cycle boundaries might also work well enough.
- You need at least two, I have three.This is a demanding indicator, and combined with multiple Gs it’s a real CPU-killer. Drop the third band if MT4 starts to chug.
- M5; half-length 74; Price 6; BandsDeviations 2.5; alerts on not including current; color: Lime Green with a Lime centre.; Arrowcolors: light green and pink
- Set visualization to M1,M5 only so that you don’t confuse this for the inner band on other timeframes.
- M15; half-length 384; Price 6; BandsDeviations 2.5; alerts on not including current; color: Turqoise. Arrowcolors: medium blue and crimson.
- Set visualization to M1,M5,M15 only so that you don’t confuse this for the inner band on other timeframes.
- (optional) H4; half-length 116; Price:6; BandsDeviations:2.5; alerts on except current; color: orange; arrowsColor: none
- Visualization: all tf
- This band is just to orient the inner bands to the overall higher TF chart. If you see green and turquoise bands above the orange dotted line you know that price is in the top half of the H4 band; it’s near the top of it’s daily/weekly range. This lets you see when price is ranging in the ‘belly’ of the beast, without having to zoom out. More bands would give you more of an idea of where price is is relative to its long-term cycles but this isn’t needed with this system, and your CPU probably can’t handle it.
- M5; half-length 74; Price 6; BandsDeviations 2.5; alerts on not including current; color: Lime Green with a Lime centre.; Arrowcolors: light green and pink
- You need at least two, I have three.This is a demanding indicator, and combined with multiple Gs it’s a real CPU-killer. Drop the third band if MT4 starts to chug.
- TipuRenko - mostly used as an exit tool, to know when it’s worth hanging on for a few more pips despite the horrifying retraces that price can make.
- BoxMode: close; RenkoMark: Brick; RenkoSize: 15; LineStyle: solid; LineWidth:2; UpColor
 aleGreen;DownColor: Pink; fillCandles:false;Alerts:true
- BoxMode: close; RenkoMark: Brick; RenkoSize: 15; LineStyle: solid; LineWidth:2; UpColor
So far this has been absolutely Al Brooksian in its 'simplicity' but it gets worse!
Process
Scanning Phase
- Update 2017/10/03: If you open RoC indicator on W1 and look at the symbols with the highest rates of change, it seems to be a good predictor of symbols that are due for a reversal (negative); ones that are near their outer band edges, or have already crossed over, with cycles that are fully formed or have begun their opposite phase. This could be a shortcut to looking over every chart, although you probably want to do that anyway. Maybe also look at RoC D1?
- Start by opening every symbol, applying the template and looking for cycle phases that are close to their start/finish. It would be good to have some theory or evidence to support an order of precedence with these so that you don’t have to check all 28 symbols, plus indexes and commodities, but at this stage I haven’t got one, aside from economic calendar news, or currency strength charts (blarg) and I’m not yet sure they should be traded. This is the ‘hard-work’ part of the system.
- Make a list of potential candidates and note the cycle phase direction. It could be good to make a ‘light’ version of the template (only 2 bands, no G?) so that you can keep all the candidates on screen simultaneously while waiting (if necessary) for signals to come in.
- From the candidate list look for band signals that have occurred in the very near past (no more than 15m I think) or that haven’t moved much from their initial signal point if it was more than 15m. Also look for charts where signals are about to occur in the near future (about to break through one of the bands.
- Make a list of the charts that have signals that agree with either the M5 cycle phase or the M15. Close the rest of the charts. This is your trading shortlist (basket). Enter trades as required using the following rules.
Entry
- If a band break produces a signal whose direction matches the corresponding cycle phase, first check higher TF to see that they are in agreement; also check overall trend, if they don’t look so good, see if you can find better trade options.
- Otherwise enter using pending orders onlyin that direction. Note that a 15m signal is also a 5m signal, it’s two trades in one.
- Especially on M15 wait for price to return inside the band, and for the Renko block to change color AND shift in the desired direction before entering since the ‘turning’ process can take as long as a day or more, and the price slippage as it does so can be excruciating. Better not to be early.
- Put a stop-loss at the recent swing high/low + 12(?) pips. Put a safety stop 2 renko box heights above/below the entry. Once price is 2 renko boxes above the entry, move it to breakeven. Trail by one two renko boxes after hitting target thereafter, or just and cash out at the band.
- Clusters of signals count as just one entry signal. A cluster is defined as signals that occur within a number of time units of each other. For now let’s say M5 signals are clustered if fewer than 12(?) candles have elapsed since the previous similar signal. For M15 let’s use 36 candles (M5 candles). Each new signal that occurs within this span restarts the clock. In this way, a cluster can be quite large and occur over a long term. Despite this, price likely won’t have moved much (maybe price movement should be a factor in this clustering calculation?) and it’s all just one signal.
Position size
- Until we get a handle on a good MM scheme, use 0.10 per $1k account size for M5 trades and 0.05 per $1k for each M15 trade.
- Note that every M15 trade is also an M5 trade so you’ll be allocating 0.15 total position size on the initial M15 signal entry.
Re-Entry (pyramiding or reversing)
- On each subsequent new valid entry signal (one that isn’t clustered) enter another position at successively smaller position sizes.
- Do not re-enter when a cycle is more than halfway through its phase. Let’s allow this for now, and see how it goes. You can re-enter right up until the cycle phase is over, as long as the band signal is good, and band centerline is sloping the right way.
- Let’s try halving the position size for every new pyramid trade. Once you can no longer divide the entry position unit, initiate no new trades or enter at the lowest possible entry size for new positions.
- If a trade fails on a clear signal, after 2 renko blocks, exit and check the cycles, and (optional) news. If a cycle has reversed it could mean the fundamentals have changed and this is a very good candidate for trading in the opposite direction.
Exits
- Exit M5 trade after reaching the other side of the M5 band
- Exit M15 trades after reaching the other side of the M15 band
- Wait for price to pierce the other side, then start to come back inside the band. That’s the exit point.
- (optional) If price is zipping in your favour, and you feel chancy, you can ignore the band break and instead wait for Renko to change colour (M5)
- (optional) Same as above except wait for Renko to change colour AND shift a block in a contrary direction. (M15)
- Of course all of this could be handled automagically with a trade manager maybe? I prefer targets to trailing stops though.So set the target tp, but allow a trade manager (GiG?) to manage the sl.
- Even if you don’t use a trade manager it would be ideal to have a script that will slip in a protective stop-loss (or move the SL to break-even) after a certain amount of gain.
- Or maybe say, as long as order logic is maintained, stay in the trade (both types) until cycle phase changes? This rule would probably work better for M5 than M15. Testing required.
- Exit unfavorable trades at the end of the cycle! This happens rarely but when it does it’s a sign of changing winds. Stay in the trade at your peril.
Future Considerations
Remaining questions:
- Are cycles at M5/15 stable enough to make trading decisions upon? Attached Image (click to enlarge)
nope
So far they appear to be very shifty, even the dominant cycle. Does this matter? I’ve seen cycles trade places in #Rnk and the overall wave, especially blended ones, don’t change much. - How should we set the sl? So far in backtests it hasn’t even been required. Still, it should be set on principle. Use the containing band? Then you will suffer the heartbreak of closing a losing trade just as it is most likely to reverse.Use a fixed pip amount? A fixed percentage? The most recent swing? Edge of 2 Renko Boxes
- Could we use cycles on a higher TF to predict what currency is likely to move the most in one direction over a week / month and focus on that one? I’m compiling and checking a database using data from ActionForex.com to find out. Basically, check what currencies moved the most in the previous days, weeks, months. Look at their cycles on various timeframes to see if a pattern emerges. What do they look like just before they go into action; that’s what we want to know.
- Does the Rate of Change indicator or a database of top mover tables help us chart the cycles of volatility? Does this predict the cycle or does the cycle predict this? It appears most of the top movers were close to a band, and are bouncing off it. Why they moved more than other symbols that were also close to a band though - I would presume the reason is cyclical but this needs to be verified.
- Greedy/foolish thought - what if we used something like PTL 2.07 during each trade to avoid awkward retraces? Likely leading to over-optimization? too many degrees of freedom, yes
- To Bartels or not to Bartels? That is the question. Whether tis nobler to leave filtered, or unfiltering, to face a thousand more templates, and comparisons between them.
- What about simply using the top 5 cycles (bartels 1 or 2? or?) no matter what, and seeing how stable that is?
- Also can we get just as good or possibly even better, results by using just 1000 maxCycleLength and 2000 pastWindowSize? Some anecdotal tests have performed well using this setting - viz.

- Can we improve on this system by also trading mid-line bounces? After price hits the target, it tends to move back to the midline, but usually doesn’t retrace all the way; then with the vanilla rules we need to wait for another signal to re-enter. Take them only in the direction of the cycle and only when price is hanging out in the ‘belly’ zone. Preliminary testing seems to indicate this works (with a little more risk), but then again, is there any need if you have no trouble fully outlaying your capital according to the original rules?
- Next settings to try for cycles - this should cut down on the cpu chewing and see if having more than one filtering cycle is worthwhile at all. Also compare stability.
Attached Image (click to enlarge) 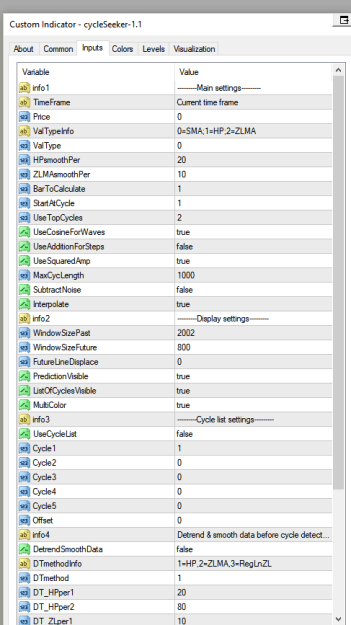
Attached Image (click to enlarge) 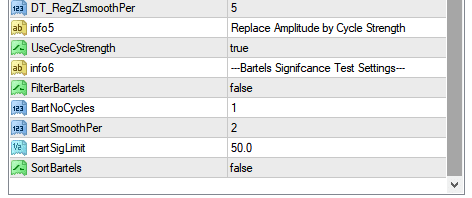
- When a trade fails, move to the higher cycle/band timeframe and trade that time frame until your next successful trade?
- Interpret failures as a strong indicator of reversed cycle direction?
- Instead of using a higher TF secondary G, use the same TF, but use a wider wavelength filter (bigger pastWindowSize) then put the shorter wave and the longer wave on screen at the same time (who needs the prediction line?) or one above the other, and enter trades when the peaks or troughs synchronize and a band signal occurs.
- Looking at longer cycles than G can handle might be worthwhile. Do a phasing analysis before placing any trades. Try ST MT demo.
Psychology
- Just when you feel tempted to throw another position onto a losing trade (averaging down) is exactly the moment when you should be taking the loss, and cutting it short by closing the initial position. Don’t average down; this system doesn’t require or specify averaging down. EXCEPT - you just said take multiple unclustered trades on entry…. How to balance these considerations?
Simplify, simplify!
1
- #403
- Jan 14, 2023 12:37pm Jan 14, 2023 12:37pm
- Joined Jul 2016 | Status: Trader | 2,534 Posts
Swing Saw

This variation of BandSaw uses the daily swing low/high as a price target, and only accepts trades that show agreement in the D1 candlestick (3 bar pattern) trend direction and the cycle direction.
So it's like a band saw Simpleton?
Instruments: Any
Timeframes: M5 (for both long and short wave G) We’re not looking to make quick trades, necessarily but high resolution data is more precise.
M15 and H4 also added as bands.
Indicators:
Currently working on a test of spectrometer instead of G. Not sure which works better. Spec works in the simulator. Simulate and demo trade both.
Pick one of
Attached Image (click to enlarge)
This variation of BandSaw uses the daily swing low/high as a price target, and only accepts trades that show agreement in the D1 candlestick (3 bar pattern) trend direction and the cycle direction.
So it's like a band saw Simpleton?
Instruments: Any
Timeframes: M5 (for both long and short wave G) We’re not looking to make quick trades, necessarily but high resolution data is more precise.
M15 and H4 also added as bands.
Indicators:
Currently working on a test of spectrometer instead of G. Not sure which works better. Spec works in the simulator. Simulate and demo trade both.
Pick one of
- CycleSeeker. 2 instances. Instance 1 (short wave) and instance 2 (long wave) The main difference between them is the first instance is tracking a shorter cycle than the second.
- TF: both M5
- Price:0; HPsmooth:20;ZLMsmooth:10;BarsToCalc:1 } I currently see no reason to change these, ever.
- StartAtCycle1-3 approx). Usually 1.
- UseTopCycles1-2 approx). I find less value in combining cycles lately.
- UseCosineForWaves:true; UseAdditionForSteps:false; UseSquaredAmp:true } don’t change these.
- MaxCycLength:
1000 for instance 1; 2000 for instance 2 - SubtractNoise: false Interpolate: true } no reason to change
- WindowSizePast. 2001 for instance 1; 4001 for instance 2
- WindowSizeFuture: 800.
- FutureLineDisplace: 0; PredictionVisible: true; ListofCyclesVisible: true; Multicolor: true } can’t see a reason to change any of these
- UseCycleList: false.
- DetrendSmoothData: false
- DTMethod settings: unimportant as we’re leaving the data trended and unsmoothed
- UseCycleStrength: true;
- FilterBartels: false;
- BartNoCycles: 1 for instance 1; 2 for instance 2
- BartSmoothPer: 2
- SortBartels: false;
- Spectrometer 2.07
- iPeriod - set using G or the longest practical period - 2000 maybe
- Cycle 1 and 2 true only; the rest false
- CycleMeter true
- Composite - try both ways.
- TMAdCGmladen-arrowsMod - 2 instances min. Optional third one for orientation. Either keep everything on M5 TF and proportionally increase the half-length or use MTF. Drop the third band if MT4 starts to chug.
- M5; half-length 74; Price 6; BandsDeviations 2.5; alerts on not including current; color: Lime Green with a Lime centre.; Arrowcolors: light green and pink
- Set visualization to M1,M5 only so that you don’t confuse this for the inner band on other timeframes.
- M15; half-length 384; Price 6; BandsDeviations 2.5; alerts on not including current; color: Turqoise. Arrowcolors: medium blue and crimson.
- Set visualization to M1,M5,M15 only so that you don’t confuse this for the inner band on other timeframes.
- (optional) H4; half-length 116; Price:6; BandsDeviations:2.5; alerts on except current; color: orange; arrowsColor: none
- Visualization: all tf
- M5; half-length 74; Price 6; BandsDeviations 2.5; alerts on not including current; color: Lime Green with a Lime centre.; Arrowcolors: light green and pink
- Currently testing other bands also. So far nothing interesting.
- TipuRenko - mostly used as an exit tool, to know when it’s worth hanging on for a few more pips despite the horrifying retraces that price can make.
- BoxMode: close; RenkoMark: Brick; RenkoSize: 15; LineStyle: solid; LineWidth:2; UpColoraleGreen;DownColor: Pink; fillCandles:false;Alerts:true
- BoxMode: close; RenkoMark: Brick; RenkoSize: 15; LineStyle: solid; LineWidth:2; UpColor
Process
Scanning Phase
- Updated 2017/10/15: Check sentiment using https://www.dukascopy.com/swiss/english/marketwatch/sentiment/
Select viable (lower spread) pairs at positive and negative extremes. Look at those pairs using the template and if they are close to cycle phase changes (or outside the containing bands), they are candidates to watch. (abandon this?) - Make a list of potential candidates and note the cycle phase direction. Look for band signals that have occurred in the very near past (no more than 15m I think) or that haven’t moved much from their initial signal point if it was more than 15m. Also look for signals that are about to occur in the near future (about to break through one of the bands.
- Charts that have signals that agree with either short or long wave cycle phase make your trading shortlist (basket). Enter trades as required using the following rules.
Entry
- M15 band trades still count for two trades, one M15 (full position) and one M5 (half position).
Use a ‘double agent’ entry technique (read BandSaw v2 entry paragraph) and enter when- Sentiment is extreme
- When price is outside a band
- When direction of daily trend and cycle direction are in agreement
- Put a safety stop 2 renko box heights above/below the entry. Once price is 2 renko boxes above the entry, move it to breakeven. Trail by two renko boxes thereafter until stop or target is hit.
- Clusters of signals count as just one entry signal. A cluster is defined as signals that occur within a number of time units of each other. For now let’s say M5 signals are clustered if fewer than 12(?) candles have elapsed since the previous similar signal. For M15 let’s use 36 candles (M5 candles). Each new signal that occurs within this span restarts the clock. In this way, a cluster can be quite large and occur over a long term. Despite this, price likely won’t have moved much (maybe price movement should be a factor in this clustering calculation?) and it’s all just one signal.
Position size
- Until we get a handle on a good MM scheme, use 0.05 per $1k account size for M5 trades and 0.1 per $1k for each M15 trade. Max risk should not be double this.
- Note that every M15 trade is also an M5 trade so you’ll be allocating 0.15 total position size on the initial M15 signal entry.
- (optional) When first starting out (newly opened account) You might want to simply start with 0.01 per $1k and add 0.01 to every new position for every trade that adds to an unbroken win streak. After a losing trade, reset this to 0.01 or half previous amount.
Re-Entry (pyramiding or reversing)
- On each subsequent new valid entry signal (one that isn’t clustered) enter another position at successively smaller position sizes.
- Let’s try halving the position size for every new pyramid trade. Once you can no longer divide the entry position unit, initiate no new trades or enter at the lowest possible entry size for new positions.
- If a trade fails on a clear signal, after 2 renko blocks, exit and check the cycles, and (optional) news. If a cycle has reversed it could mean the fundamentals have changed and this is a very good candidate for trading in the opposite direction.
Exits
- Set tp to exit all trades 5-10 pips above/below the previous daily swing high/low. Unless that would be a less ambitious target than exiting at the bands. Maybe it usually is. Needs checking.
- Of course all of this could be handled automagically with a trade manager. Set the target tp, but allow a trade manager (GiG?) to manage the sl.
- Even if you don’t use a trade manager it would be ideal to have a script that will slip in a protective stop-loss (or move the SL to break-even) after a certain amount of gain.
- Exit unfavorable trades at the end of the cycle! This happens rarely but when it does it’s a sign of changing winds. Stay in the trade at your peril.
Future Considerations
Remaining questions:
- Are cycles at M5/15 stable enough to make trading decisions upon? I think so, but there is an interesting ‘cycling’ of cycle peaks that needs further study. NO
- Does extreme sentiment anticipate the most extreme price movers? Appears no, but more testing needed. Drastic change in sentiment over a short time also doesn’t seem to herald a big move, necessarily.
- What about a disappointing or reversed swing high/low compared to the previous opening price? Sometimes the pent-up energy results in big compensatory swings. Sometimes, is not an edge.
- Can we improve on this system by also trading mid-line bounces?
Evidence says yes. Maybe add this to new version. Next settings to try for cycles - this should cut down on the cpu chewing and see if having more than one filtering cycle is worthwhile at all. Also compare stability.
Musings on trade selection and entry type selection
What are some of the factors that could influence selecting a suitable instrument to trade?
- Sentiment extremes
- Big changes in sentiment (important?)
- Big price moves (signals potential overbought/oversold or retrace opportunities)
- Piercings of multiple bands (t3 and b3 to use the nomenclature of [redacted for privacy]) I was a fan of PB since I first heard his interview with David Hickson.
- Long stretches outside a containing band
- Imminent Cycle phase changes, especially long cycles
- Anything else?
Can we make a ‘score chart’ or even a script that will evaluate each of these criteria, assign a point value to each one, and summarize the whole thing to give you a top basket of potential instruments? An idea that would persist for many years.
How do we turn this into a consistent plan of action?
Make a step-by-step procedure list for the saw series
- #404
- Jan 14, 2023 12:41pm Jan 14, 2023 12:41pm
- Joined Jul 2016 | Status: Trader | 2,534 Posts
Simple Saw Step-by-Step
Having a step-by-step plan isn't a bad idea necessarily. However this is all based on poorly understood (at the time) cycles theory.
Having a step-by-step plan isn't a bad idea necessarily. However this is all based on poorly understood (at the time) cycles theory.
- Scan sentiment extremes on https://www.dukascopy.com/swiss/english/marketwatch/sentiment/
We do this to find instruments that are likely to have already reversed or will reverse in the near future, although it should be understood that it can take days for this reversal to take place at all which is why we’ll be using a ‘Double Agent’ entry. Don’t fight the daily trend. You can get lucky sometimes but it’s picking up nickels in front of a steamroller.
- Scan these instruments for swings high and low on the D1. If none (or not enough) are found, repeat the search using the list of top movers on https://www.actionforex.com/markets/top-movers on the daily
This is predicated on a 3 bar swing low/high being a solid reversal sign. Looking at history this appears to be the case, but it’s not infallible, so we’ll drill down to make our entry.
- Make a list of any recent (current) swings and their anticipated trend direction. Note when to check back on instruments that are not yet reversing on the D1.
Even if we don’t trade all the opportunities, checking the success/failure of all candidates should give us some insights on whether/how something works.
- Open their charts and look at their cycles on D1 (or H4 if insufficient data). Discard any charts that are not cycling the same way or are not about to.
Add the discards to the ‘watchlist’.
- Drill down to H4, H1, etc and continue until you only have the desired number of trade opportunities. What you have left over should, in theory be the best short-term candidates.
For now let’s say 1 trade per $1k equity.
- Switch to M5 or even M1 charts and wait for a band signal that is in agreement with the dominant cycle (just one cycle for now but create a variation for more cycles)**.
This gives us a finer entry, and chance to check the cycles using maximum data resolution.
- If that signal is counter to anticipated daily trend, use the double agent entry with a stop at the inner band midline by entering at ⅛ regular position size. The ‘double agent’ is a trade that we expect to have limited success or even failure, but that is following the current mini-trend. If we’re wrong, the trade will continue to gain in value. Keep stalking the s/l. It’s OK to set a tp on this trade also. If we’re right, the loss will be small, and you can immediately enter the true trade. Whether a loss or a gain, if conditions are still good for a reversal, when the trade hits its stop, prepare to enter for real.
For now we’re using 0.1 per $1k as a regular trade, so ⅛ is 0.13 for double agent entries.
- If the signal is in the direction of the anticipated trend, enter with a full position, and no official stop. The unofficial stop is 1.5x the width of the band. If price moves against you this much you were wrong in a big way. Keep a log with loss trades so you can study them.
No stop to avoid stop outs and initial jitters.
- Exit with a tp or sl set to 10 pips above the previous day’s high/low. If this is the first trade after the swing/high low is spotted use the highest high or the lowest low of the 3 bar pattern as target.
Instead of exiting with a band, we use the likely highest or lowest point of the day for all trades.
- Optional addition. For blue band or higher TF trades, exit at the next swing high/low.
Future: **Try a variation of this that uses 7 cycles (both G and Spec) to form a composite wave that reacts to price. Compare what works better - more foreshadowing or less.
Also - do these step-by-step summaries work better than the section-by-section outlines? Try writing step-by-steps for every strategy you’ve conceived and then re-test them to see how it makes a difference. Refine the steps to be ever more mechanical and less subjective. Thankfully I did not do this. Sometimes laziness is a blessing.
- #405
- Edited 10:51pm Jan 14, 2023 12:46pm | Edited 10:51pm
- Joined Jul 2016 | Status: Trader | 2,534 Posts
Double Breasted Suit

New indicators; same idea. Revisited some time after the first series.
Indicators
DSS Bressert - cycle set to 1st cyc using G
Recursive Stoch - smooth = double ~20
Bollinger bands - (3devs)
G Browser
H1 TF
Use G to find securities likely to trend (supertrend?) or reverse
Signal when Bressert & Rec Stoch are in agreement over 80 or unde 20
Then, wait for price to approach /hit the side opposite of the bands as the desired trading direction and bounce away from the bands, OR if that doesn’t happen but price cleanly heads away and breaks through the bands then enter. Note, waiting on H1 can take days. 3-4+. Patience padawan.
OR
Trade only in direction of DSS+RS and exit every time price approaches the (what???)
Re-enter when price crosses opposite band.
Re-enter when prices crosses back - or to other band
Crosses centre?
Exit - on hitting 3rd band of desired direction or when DSS slop (colour) changes, or if price comes back to center BB?
Pos. 52 - use G to pick from a 40/30/30
50/30/20 system?
Sun - check for good prospects using cyc. And read/photo Grafton
*Use limit orders to enter positions ONLY as that will confirm trend is going your way - don’t just go by Bressert or correlation w/ G. Make price meet you.
Attached Image (click to enlarge)
New indicators; same idea. Revisited some time after the first series.
Indicators
DSS Bressert - cycle set to 1st cyc using G
Recursive Stoch - smooth = double ~20
Bollinger bands - (3devs)
G Browser
H1 TF
Use G to find securities likely to trend (supertrend?) or reverse
Signal when Bressert & Rec Stoch are in agreement over 80 or unde 20
Then, wait for price to approach /hit the side opposite of the bands as the desired trading direction and bounce away from the bands, OR if that doesn’t happen but price cleanly heads away and breaks through the bands then enter. Note, waiting on H1 can take days. 3-4+. Patience padawan.
OR
Trade only in direction of DSS+RS and exit every time price approaches the (what???)
Re-enter when price crosses opposite band.
Re-enter when prices crosses back - or to other band
Crosses centre?
Exit - on hitting 3rd band of desired direction or when DSS slop (colour) changes, or if price comes back to center BB?
Pos. 52 - use G to pick from a 40/30/30
50/30/20 system?
Sun - check for good prospects using cyc. And read/photo Grafton
*Use limit orders to enter positions ONLY as that will confirm trend is going your way - don’t just go by Bressert or correlation w/ G. Make price meet you.
- #406
- Jan 14, 2023 11:05pm Jan 14, 2023 11:05pm
- Joined Jul 2016 | Status: Trader | 2,534 Posts
Around the World in 80 Trades

Not to be confused with Around the World, though they are both based on Hickson/Hurst theory.
A procedure for trading intraday using manually phased charts and something like a SMMA, if not the SMMA itself.
Attached Image (click to enlarge)
A procedure for trading intraday using manually phased charts and something like a SMMA, if not the SMMA itself.
- Get avg cycle periods and add together most commonly seen (most stable) and divide by the total. Read what Millard has to say about cycle stability
- Use the resultant periods to anticipate entries/exits
Simul-testing suggests cycle periods are most shifty and rarely repeating. (boo!)
Phasing tip/idea - peaks produce troughs and troughs produce peaks. If there isn’t a significant down move after your marked point it’s not likely the peak, and if there isn’t a significant up move after your marker it’s probably not the trough, even if that point is lower or higher than past history. As Hurst himself suggests, wait for price to break up through the FLD.
Place grids of pending orders with steadily increasing values. The idea is that as price moves further from the MA it becomes increasingly unlikely to go further without retracing so you’ll be rewarded more for a Std. Dev. trade of 3.0 than 1.0. The danger in this is that if price decides to trend strongly (and unexpectedly) you’ll bust your account fast.
And that's pretty much what happened.
1
- #407
- Jan 14, 2023 11:12pm Jan 14, 2023 11:12pm
- Joined Oct 2019 | Status: Forexian Fighter = FF | 16,341 Posts
DislikedAround the World in 80 Trades {image}Not to be confused with Around the World, though they are both based on Hickson/Hurst theory. A procedure for trading intraday using manually phased charts and something like a SMMA, if not the SMMA itself. Get avg cycle periods and add together most commonly seen (most stable) and divide by the total. Read what Millard has to say about cycle stability Use the resultant periods to anticipate entries/exits Simul-testing suggests cycle...Ignored
two columns: one for facts(objective) and another for our opinions(subjective)
among facts: (something like Phythagorean rule)
1. EURAUD alwas is EURSD/AUDUSD
2. Correction is a market essense nature (while opinion is: when the market will correct)
3.
4.
5.
each day 10%,,,, https://www.forexfactory.com/thread/1371538
1
- #408
- Jan 14, 2023 11:50pm Jan 14, 2023 11:50pm
- Joined Jul 2016 | Status: Trader | 2,534 Posts
Around the World in 20 Trades

I'm shocked I can't find any templates for any of these 'Around the World' systems, but here are some screenshots from a system that simply counted cycle periods manually rather than using any Hurst/CycleSeeker magicks.
You can see what makes cycles so seductive; sometimes they seem like clockwork. They always let you down at the crucial moment though.
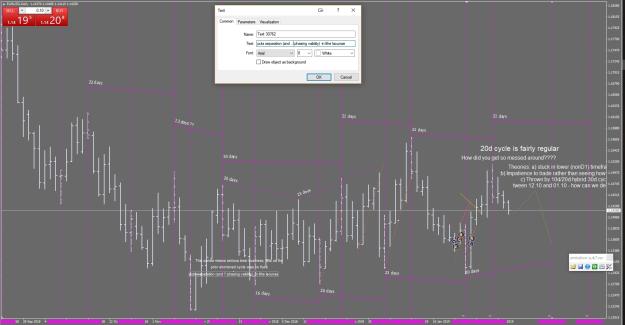
Once we get into mid-December, the troughs come in regularly about 20 days apart; the peaks as well. What's price doing? Not trending strongly, that's for sure.
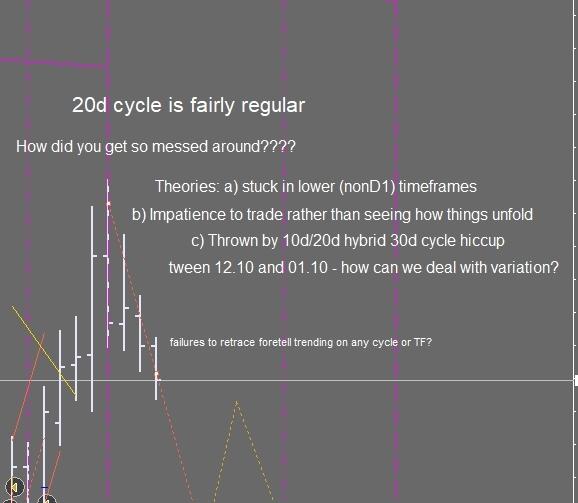
'Failure to retrace foretells trending on any cycle or TF'. Well, this appears to be Humphrey's suggestion as well (Tape Reading and Market Tactics) but don't forget that failed breakouts are more common than breakouts. And this was devilishly hard to trade. Might be worth trying again though, only for ranging prices.
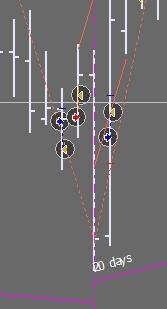
These don't look like the types of trades we'd want to make playing this cycle? You need to be far more patient. This may simply be a case of personality mismatch.
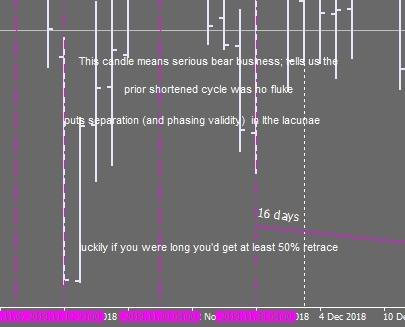
"This candle means serious bear business. (I think I mean the 2018-11-12 daily candle, you can't really make out the date because the jpg is too compressed) it tells us that the prior shortened cycle was no fluke (but I mean cycles analysts are always saying things like this and always about 50% right) puts separation and phasing validity in the lacunae." Lacunae are empty spaces in price, the gaps that show separation between a rise and a fall. What do I mean by 'phase validity'? I'm not so sure. The empty gaps are confirmatory of a new cycle? I should have kept better records.)
In the end the bear candle wasn't so bearish at all, it was a sign of a trend completion.
Attached Image (click to enlarge)
I'm shocked I can't find any templates for any of these 'Around the World' systems, but here are some screenshots from a system that simply counted cycle periods manually rather than using any Hurst/CycleSeeker magicks.
You can see what makes cycles so seductive; sometimes they seem like clockwork. They always let you down at the crucial moment though.
Attached Image (click to enlarge)
Attached Image (click to enlarge)
Attached Image (click to enlarge)
Attached Image (click to enlarge)
In the end the bear candle wasn't so bearish at all, it was a sign of a trend completion.
1
- #409
- Edited 4:12am Jan 15, 2023 12:04am | Edited 4:12am
- Joined Jul 2016 | Status: Trader | 2,534 Posts
Attached Image (click to enlarge)
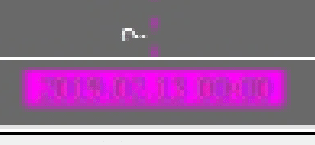
I'm pretty sure this says 2019.02.13.
How did my cycle prediction go? I thought the bearish cycle would complete 2019.02.13 or possibly 2019.02.20. What did price actually do?
It bottomed on 2019.02.15. The total amount of pain I'd have to endure in terms of time, is 24h, and in terms of price, if I'd gone long at the close of 2019.02.13 is shown by the magenta rectangle. When did price make a peak? Exactly 20 days after the prior peak.
Attached Image (click to enlarge)
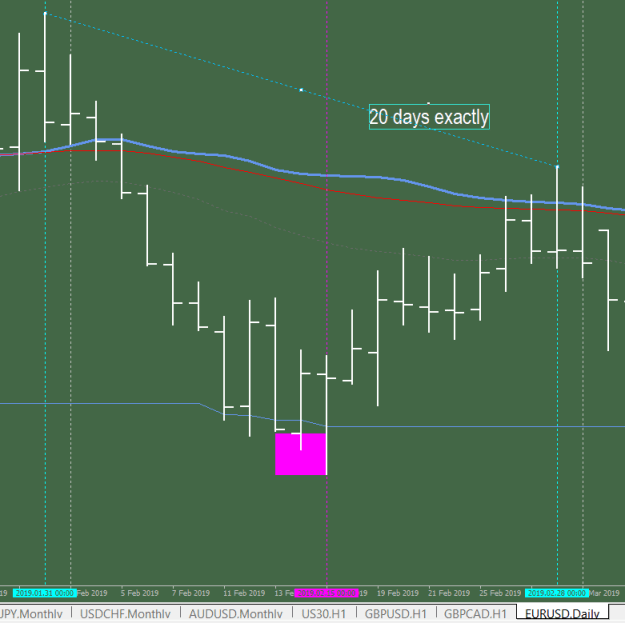
CLOCKWORK. And you can't make a profit with that??! This is the kind of scorn I endured on the Hurst boards. "How dumb are you anyway?!?"
Well, look, when it works it looks like magic and when it doesn't work you wonder why. Why doesn't it work sometimes?! Too many people seeing the same thing. Too much motivated buying or selling. Randomness. Still, I should consider revisiting this arcane art. OR SHOULD I??
- #410
- Jan 15, 2023 4:21am Jan 15, 2023 4:21am
- Joined Jul 2016 | Status: Trader | 2,534 Posts
Variance Tables
Just like Niederhoffer, I want to know how long things are likely to last and how long I'll have to be underwater in any trade.
However, these days, like Marty Schwartz, I think it's probably better to limit any underwater time to a few minutes or hours, tops. In the olden days I would try riding weekly cycles or even larger. It's torture, unless you're buying and holding.
I also had a lot of trouble figuring out a good way to graphically represent all the information that you need to show. Hickson's Hurst Cycles software 'Sentient Trader' was good at this, but was very clunky for producing custom models. I tried using Excel, but it's also not well suited to the task.
I clearly gave up after just a few weeks. It might be worth having this info when you are trading a bigger account.
Just like Niederhoffer, I want to know how long things are likely to last and how long I'll have to be underwater in any trade.
However, these days, like Marty Schwartz, I think it's probably better to limit any underwater time to a few minutes or hours, tops. In the olden days I would try riding weekly cycles or even larger. It's torture, unless you're buying and holding.
I also had a lot of trouble figuring out a good way to graphically represent all the information that you need to show. Hickson's Hurst Cycles software 'Sentient Trader' was good at this, but was very clunky for producing custom models. I tried using Excel, but it's also not well suited to the task.
Attached Image (click to enlarge)
- #411
- Jan 15, 2023 4:29am Jan 15, 2023 4:29am
- Joined Jul 2016 | Status: Trader | 2,534 Posts
Peak and Trough Averages
Now this was an interesting idea, much simpler than a variance table. Just track the average time from peak to trough of various lengths cut up and arranged along the lines of the nominal cycle model.
What do you learn? The variance of these average times is INSANE.
It's why Hurst cycles aren't great for trading. It's what Mandelbrot spends most of his time in his financial books warning people about.
You can know on average how long you'll be waiting for the market to reach the bottom, but the actual future number could easily be double what you're expecting based on prior history. More than enough time to go broke. This is what eventually sunk Niederhoffer, I think; and since he was a fairly mathematically savvy guy, it's either that he understood it but didn't 'grok' it or he was willing to dance with the White Lady (Fortuna).
Attached Image (click to enlarge)
- #412
- Jan 15, 2023 4:31am Jan 15, 2023 4:31am
- Joined Jul 2016 | Status: Trader | 2,534 Posts
Disliked{quote} One of the toughest theories that iam have been concerned with, is to list market facts and market opinions two columns: one for facts(objective) and another for our opinions(subjective) among facts: (something like Phythagorean rule) 1. EURAUD alwas is EURSD/AUDUSD 2. Correction is a market essense nature (while opinion is: when the market will correct) 3. 4. 5.Ignored
- #413
- Jan 15, 2023 4:44am Jan 15, 2023 4:44am
- Joined Jul 2016 | Status: Trader | 2,534 Posts
Fawkes Loves Dumbledore
 It's a title whose acronym is FLD, get it? Forward Line of Demarcation? Oh, we never talked about Hurst.
My snarky little note says that Bifrost (remember the Jotun smoothed moving average?) is better at finding the extent of the trend than an FLD, and that doesn't surprise me.
Ok, let's go through these screenshots next.
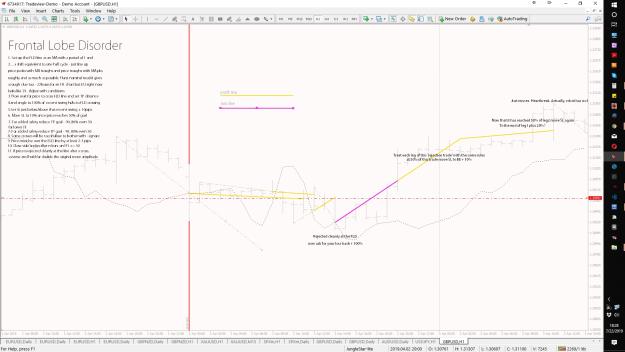
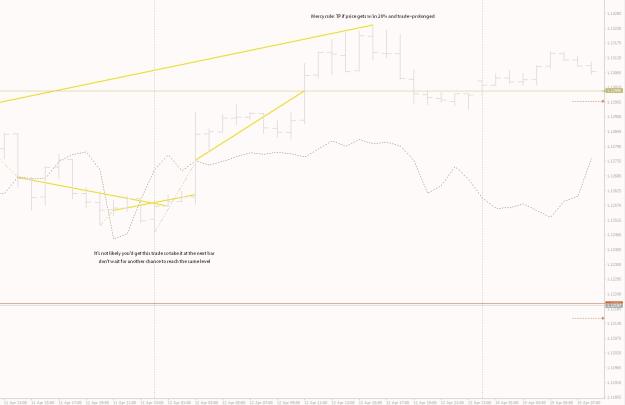
Attached Image
- Set up the FLD line as an MA with a period of 1 and a shift equivalent to one half cycle (this is a close approximation of Hurst’s Forward Line of Demarcation). To get the period right line up price peaks with MA troughs and price troughs with MA peaks, roughly, as much as possible. The Hurst nominal model might provide a clue too. - 22 hours for an H1 chart but EU right now looks like 29 - adjust with conditions as every good trader must.
- Wait for price to cross the FLD line and set the TP distance - measuring from most recent swing high/low to the point of crossing. Match the angle as well - simply make a copy of the trendline that you use to measure the first move and move it on the other side of the line like a mirror image.
- Set a SL just below the most recent swing.
- Move the SL to 10% once price reaches 50% of its goal.
- For added safety reduce the TP goal - 90,80% even 50% for lower TF
- Some crosses will be too shallow to bother with - ignore them.
- Price must be over the FLD line by at least 2-3 pips (depends on TF)
- Close stale trades after n bars on H1 <= 50.
- If price is rejected cleanly at the line after a cross, reverse and hold for double the amount of your loss.
- Use Phoenix trades
See screenshots for additional details and rules - clean this up later. (I didn't.)
X:\Trading\Systems\_FLD
Attached Image (click to enlarge)
My snarky little note says that Bifrost (remember the Jotun smoothed moving average?) is better at finding the extent of the trend than an FLD, and that doesn't surprise me.
Ok, let's go through these screenshots next.
- #414
- Edited 5:32am Jan 15, 2023 5:00am | Edited 5:32am
- Joined Jul 2016 | Status: Trader | 2,534 Posts
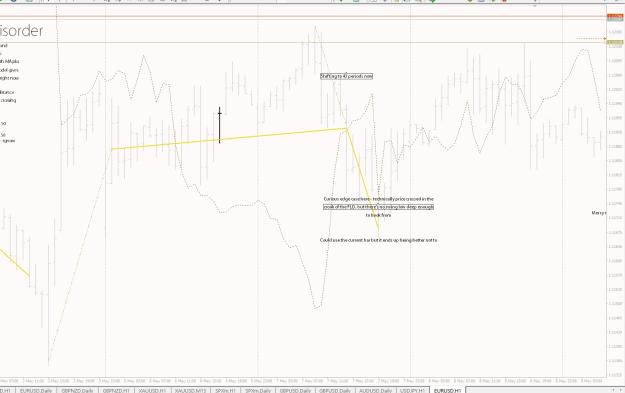
Attached Image (click to enlarge)
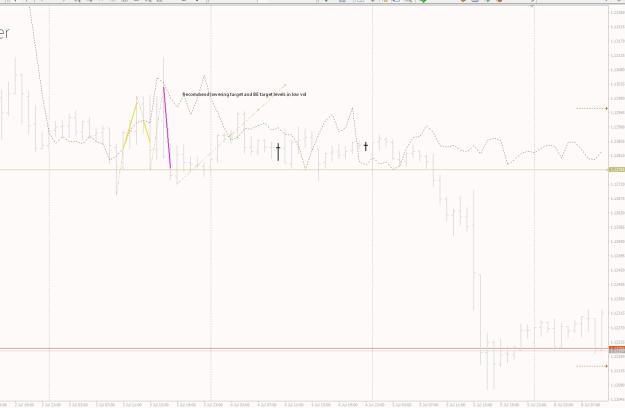
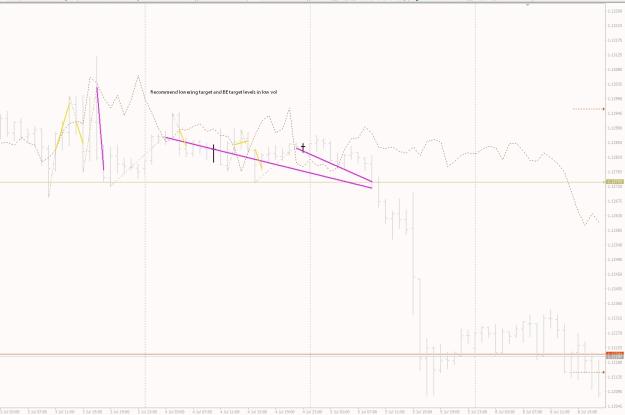
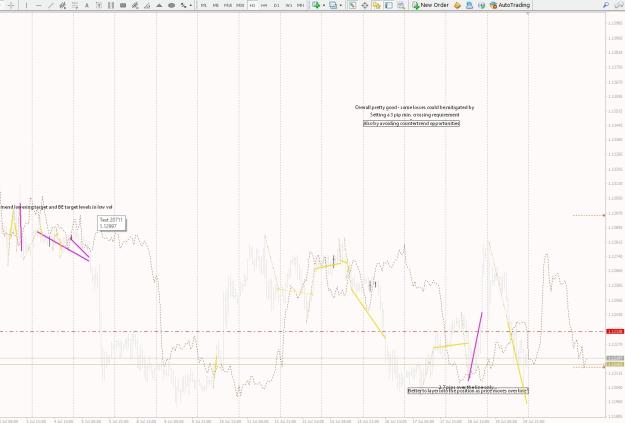
"This loss, 10 or so pips...price didn't get to 50% so SL didn't move". We move to secure profits only if there's enough profit to bother with. So that's a small loss. Price broke down through the FLD, and moved up beyond the most recent RE (local peak) hitting the stop. If it hadn't done that we would have expected a profitable move down equivalent to the length of the trendline that we drew. I would have duplicated it and moved its left end to the point of the crossing. This would give me the approximate angle and duration of the profitable trade, and if I didn't like either of them I could get out.
Just above, you can see the result of a very successful long trade, that doesn't look like it will work at first. Since the swing below the FLD is so big, we give it more time to work out.
Attached Image (click to enlarge)
By the way, have you noticed this thing is hitting nothing but winners? We've had one tiny loss and 1/2 a dozen larger winners.
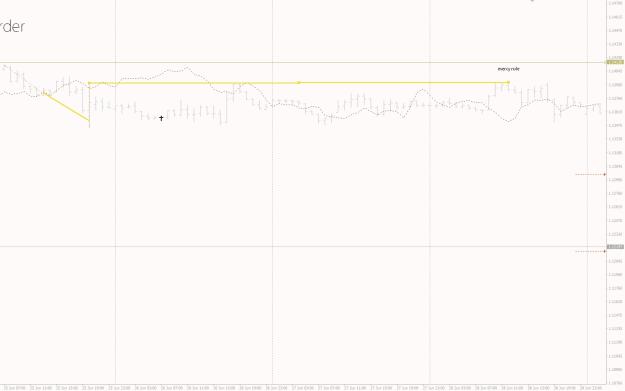
Mercy rule: if price gets near our target (within 20% or so) but then starts loitering, just take the win. In backtesting this is not as profitable but psychologically ...merciful.
- #415
- Jan 15, 2023 5:10am Jan 15, 2023 5:10am
- Joined Oct 2019 | Status: Forexian Fighter = FF | 16,341 Posts
Disliked{quote} This is a very good practice. But my goodness, man! What are #3, 4 and 5???Ignored
each day 10%,,,, https://www.forexfactory.com/thread/1371538
- #416
- Edited 5:34am Jan 15, 2023 5:22am | Edited 5:34am
- Joined Jul 2016 | Status: Trader | 2,534 Posts
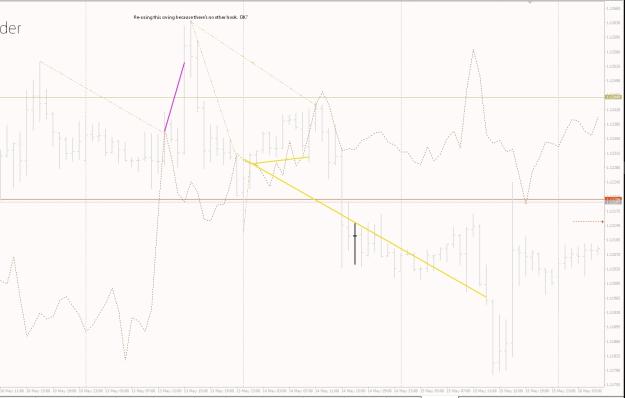
Attached Image (click to enlarge)
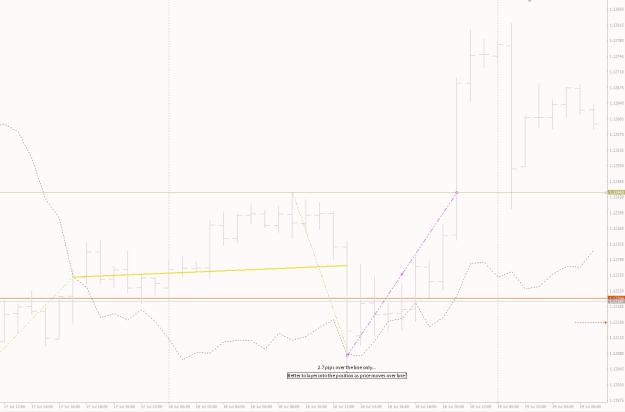
First, notice the win on the left. Not the bear trade whose origin is cut off, the bull trade after that. It enters on May6 right after open. I don't enter at the FLD crossing point. I enter at the point where the trendline, the one I borrowed from a recent bit of price history, crosses the price bar. I don't enter right on the opening daily bar, that's nuts. However it seems to break some rules. First, I'm entering long just as price dropped below the FLD. I didn't enter on Friday when price first moves across the FLD, because...? Too late in the week? I also exit the trade when price returns to the FLD. All new rules?
It also looks like the following trade changes to the FLD cycle period. How do I arrange that? What am I using to measure cycles? No info given.
No I get it now, but I could use the bar two back from the crossing; whatever, these are meaningless details in the grand scheme of things.
Attached Image (click to enlarge)
- #417
- Jan 15, 2023 5:25am Jan 15, 2023 5:25am
- Joined Jul 2016 | Status: Trader | 2,534 Posts
3 facts is pretty good. Better than most people have. However maybe there are some others.
- #418
- Jan 15, 2023 5:30am Jan 15, 2023 5:30am
- Joined Jul 2016 | Status: Trader | 2,534 Posts
Attached Image (click to enlarge)
Attached Image (click to enlarge)
- #419
- Jan 15, 2023 5:44am Jan 15, 2023 5:44am
- Joined Jul 2016 | Status: Trader | 2,534 Posts
Attached Image (click to enlarge)
Attached Image (click to enlarge)
Attached Image (click to enlarge)
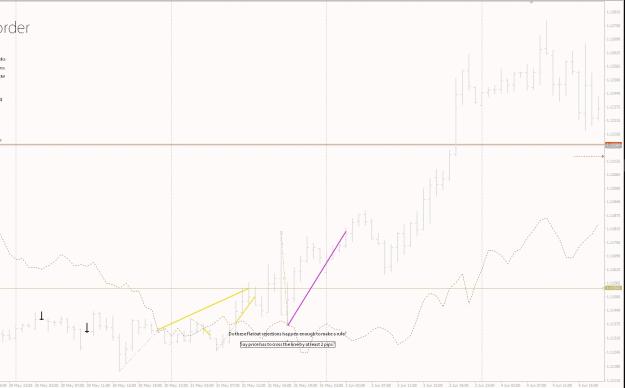
In this case I'd have taken one small loss and would have stopped entering short as price never confirms the short again. The problem with scaling in is that it's only practical when your trade target is sufficiently far away. Small trades don't give you time to scale. So instead of scaling in/out I created a rule which is already in the original description - when the trade goes awry, enter double in the opposite direction. I don't see that reaction trade here though. Which is too bad because it would have killed.
- #420
- Jan 15, 2023 5:51am Jan 15, 2023 5:51am
- Joined Jul 2016 | Status: Trader | 2,534 Posts
Attached Image (click to enlarge)
Attached Image (click to enlarge)