Disliked{quote} Hi RickM, Please do show us some examples of what you are referring to. If you have access to the futures volume, just screenshot one of the pairs in both futures and mt4 and give your analysis. If you can show an hours worth of 1minute data on both platform and show the delta between the two that would help a lot. Chhico, may be right that 90% of the mt4 volume correlates to the volume found in futures.Ignored
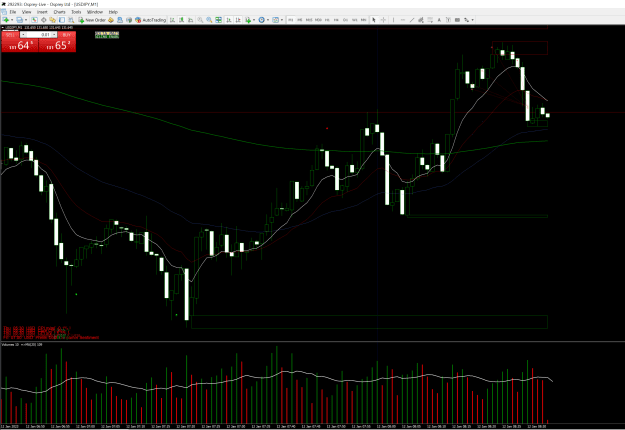
Here is two charts,
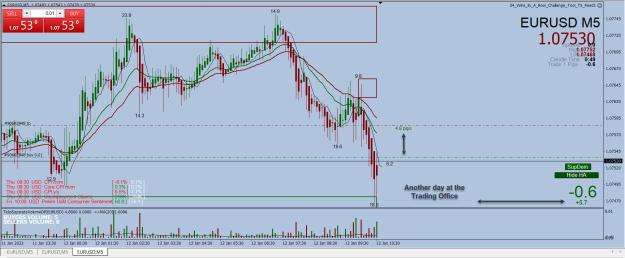
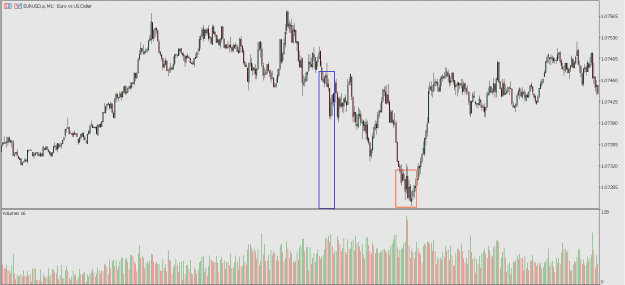
Top - EURUSD from spot forex showing MT5 volume
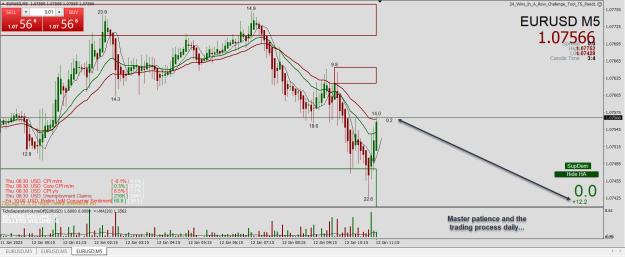
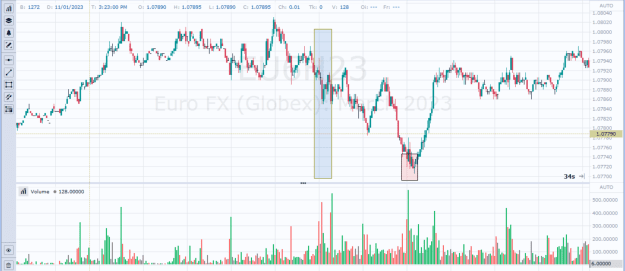
Bottom - EU6H23 which is the EURUSD Futures Version showing Futures Volume.
Spot EURUSD & Futures EU6H23 are both connected by swaps, creating a way to measure volume as if it came from a centralized exchange. You can trade spot EURUSD and borrow the signals off the Futures version and you can be sure its accurate representation as seen on a histogram indicator.
Just use ClusterDelta on MT4 or MT5 and your back in the game.
This was from yesterday's open on EURUSD and you can see (in blue box) the London Open was flat with little big player involvement. A decent spike on EURUSD is normally around 8 times average volume from the day, massive Red news may cause spikes with volumes 30 times larger than normal volumes.
What can you see, that in the Futures Volume there was only a few spikes around London open but mostly volume sat around average. Looking at the Spot Tick volume on MT5, you can see it was constant for an hour before which is just crap. No big player is trading much before London open, volume should be low and uninterested.
Yet Tick volume shows lots of volume which is just rubbish.
Both charts showed the highest volume when some big player stepped in to start buying the EURO.
But what Tick volume shows is tick activity caused by volatility which can occur in two circumstances. One is high volume because the tick movement is high and in low volume because gaps create big tick movements which produces big bars.
Therefore
High Tick Chart Volume is often caused by gaps in liquidity and mistaken for high Volume when its just a measurement of volatility.
Now
I am not saying Chhico can't trade with data off Tick Volume, I am saying he is trading Tick Volatility which may still result in a good trade.
Just don't believe its volume.
I am not here to be a pain in the arse, just hoping just one trader finds just one of my posts is usefull.
Cheers
Attached Image(s) (click to enlarge)
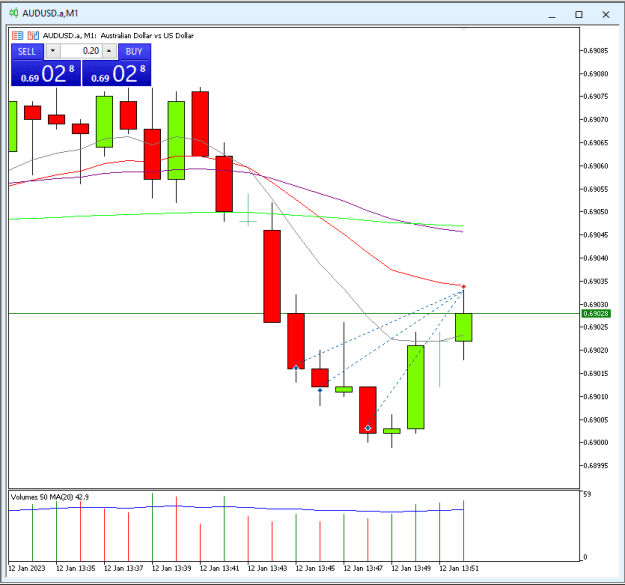
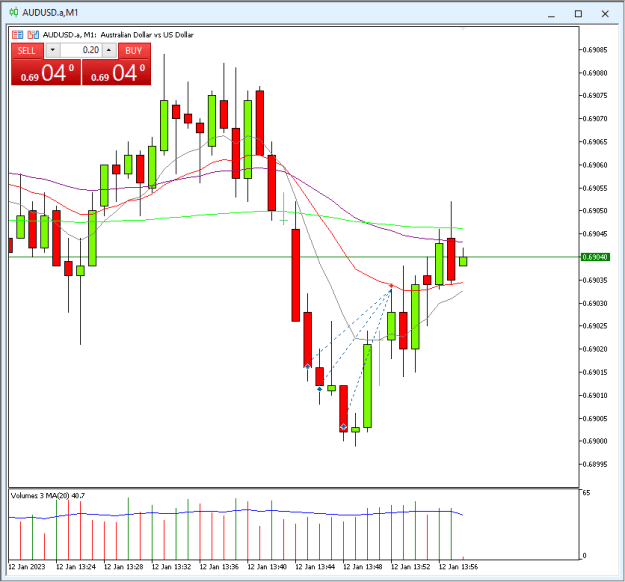
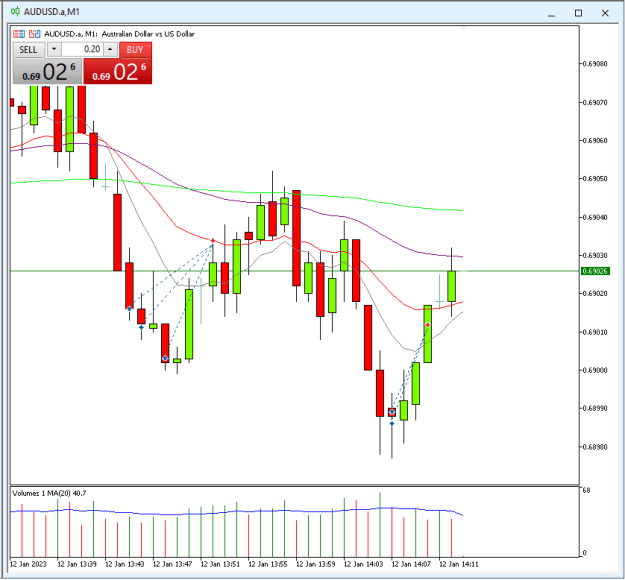
Trading thin liquidity at the boundary of the charts
8