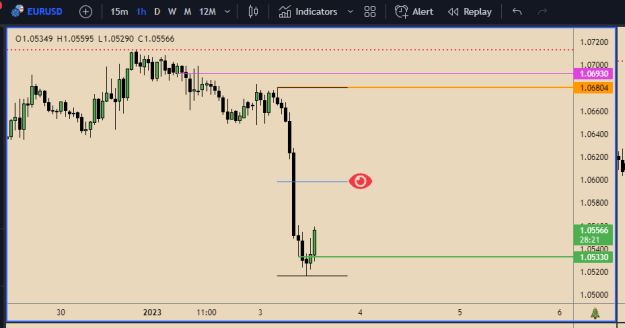
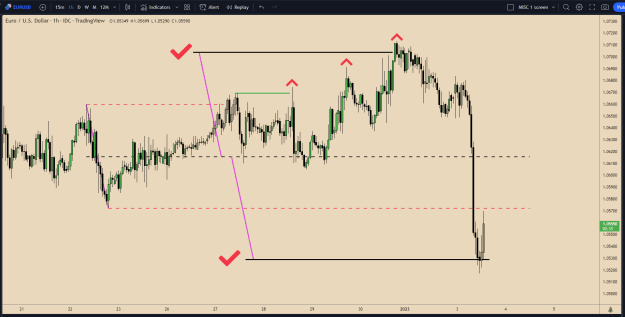
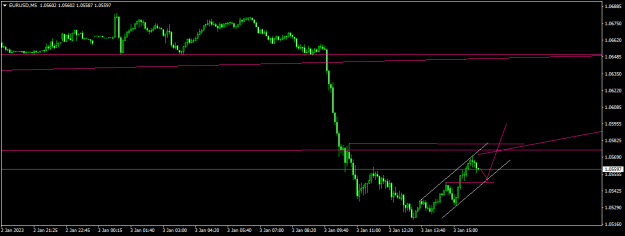
From the daily, long-term downtrend needs that second rectangle to be cut straight through to potentially avoid increased chances of another series of ranging days at the wrong place! Enough is enough !
Notice how the last 13 days resembled the May and June struggle (1st rectangle from above). Notice how, this time, it all happened slightly lower.
My own best case scenario is that the day outperforms bulls best day, Nov.10th = .03 = July levels = potential start of the end of this correction in a downtrend.
So, still a lot of work !
If I don't mention SL and/or TP = longer-term setup possibly in the works!