Instruments: Any, but start with the old chestnuts, EURUSD and XAUUSD
Timeframe: Trading on H1, maybe some fine tuning on M15. Scanning on D1. Phasing on W1. If this works you could and maybe should, try a lower trading timeframe.
'Phasing' shows I was still deep in the thrall of cycles mythos.
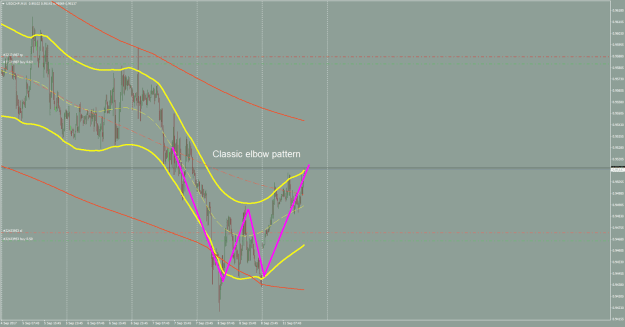
This system doesn’t worry about minima/maxima, as the trading rules basically take care of that. It finds the elbows (turning points) in bands and rides trends, even the tiny ones in ranging periods. It should be a ‘myopic’ system, to use the terms of economists because being able to predict future turns of any cycle isn’t crucial to its success.
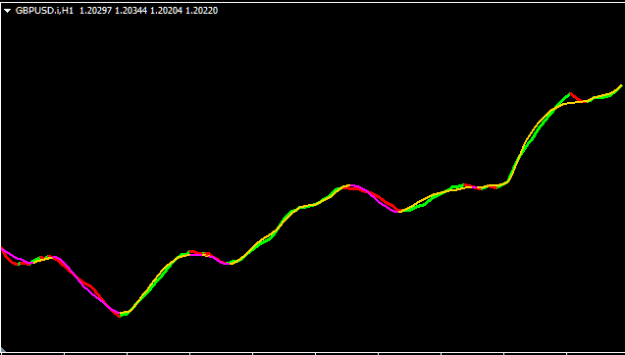
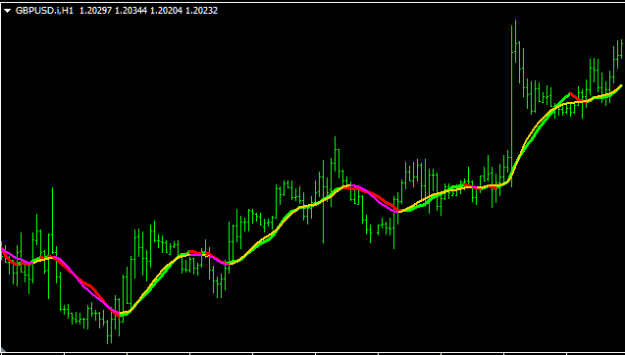
Indicators: (use numbers that give a good band fit without being too ‘stringy’ (subjective) or leaving gaps between price peaks/troughs and the band walls.
- TMAdCGmladen-arrowsMod a
- Turn off the centerline colors, it’s a repainting siren liar
- Then why use it?!
- Don’t rely just on the red and blue dots. Sometimes they disappear or don’t show up for some reason. Look at the actual piercings. Maybe the line is coming down across the tops of some smaller peaks as price changes.
- Tipu Renko
Optional:
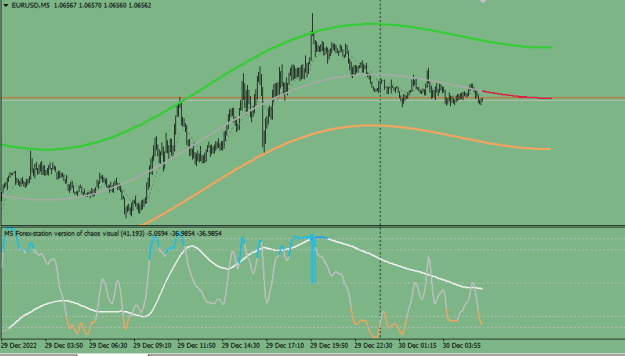
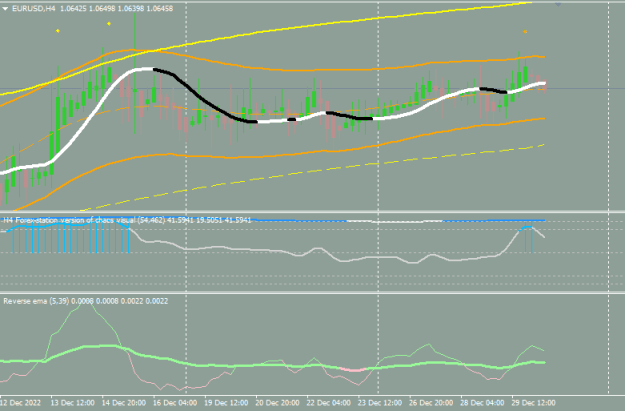
- Chaos Visual averages
- Heiken Aishi candles (as per guttersnipe)
Process
- Scan
- Scan on W1/D1/ and look for price piercing (or approaching) a container band. Identify likely reversal points. Write them in a notepad/journal maybe. Watch/listen for signals
- Also phase each symbol of interest, and note its dominant cycle and maybe plot a possible future price direction -no need to be too specific
- Identify the most likely trade candidates. Put them in their own group, and switch to the H1 for those symbols. Or just stick with gold and EURUSD/USDJPY
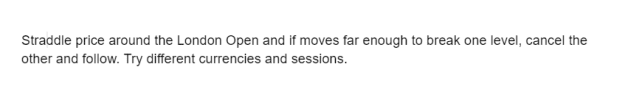
Entry
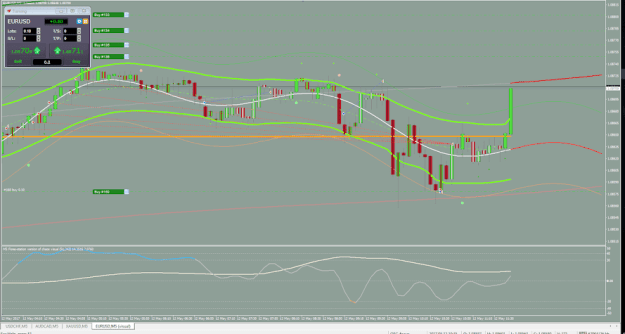
- The idea is to watch green band (H1) piercings, and take a trade from one side of the orange band (the container band) to the other, or as far as possible if that isn’t happening. You can also take higher TF (longer horizon) trades by watching the orange (H4) bands and taking a trade from one side of the yellow (D1) container band to the other. It might also be possible to trade lower than H1 (M5??) using the same principles but it might be too chaotic and more effort than it’s worth. It is worth investigating once you’ve mastered this system.
- Wait for a band piercing
- Wait for a confirming (color change) renko block signal OR
- A confirming signal from Jack;
- A confirming Jack signal is one that is either higher or lower than the previous signal of its type, suggesting a change of price direction.
- So for example, suppose price pierces the green band at the top, it will likely generate a Jack sell signal (often, a cluster of them, but the whole cluster should be treated as a single signal). That signal is valid if and only if it is lower than the previous Jack sell signal. If that’s the case this is a valid entry.
- Suppose price pierces the green band at the bottom, generating a buy signal. It also pierced the orange band, generating a higher TF signal. This is probably a local trough, and it may be a while before you get a Jack buy signal, so follow the Renko block lead. Once you get a green block, go long. You can enter one trade for the H1 TF and one for the H4.
- Optional: Re-enter on future clusters of signals that confirm the band direction you’re trading from, as long as they satisfy the preceding criteria. Always use a lighter weight for every pyramiding trade.
- The first trade is the trickiest. (why is that exactly?) It might be worthwhile to wait only for higher TF band touches and reversals, then follow the flow. Don’t exit too early, as it is hard to get back in sync.
The idea is to ride these trades for the max duration of their respective (half) cycles. Only add to new positions when price is validating it, and only when price hits the other band (buy/sell on dips). To do this, simply ignore long signals that are not higher on bottom band touch and ignore short signals that are not lower on top band touches. See explanation below. At a future date, if practical, modify the indi to ignore invalid alerts.
Demanding such a specific outcome from the chaos of the marketplace is asking for trouble.
Exiting
There are only two exit signal types:
- Band piercings
- Jack signals in which the order logic is contravened (see below). Wait for a buy signal to close a short or a sell signal to close a long unless price is zooming away from and/or distorting containing bands. If this second signal is itself a continuation of the original trend, then don’t exit. In this way, you need 2 different signals to exit on Jack signals.
- It’s probably just fine to sneak some stops up well behind each swing high/low to lock in profit.
- Note that Renko blocks are not exit signals. By the time a renko block is confirming an exit, price should have pierced a band or made a Jack signal that alerts to a changing trend. See Renko notes below
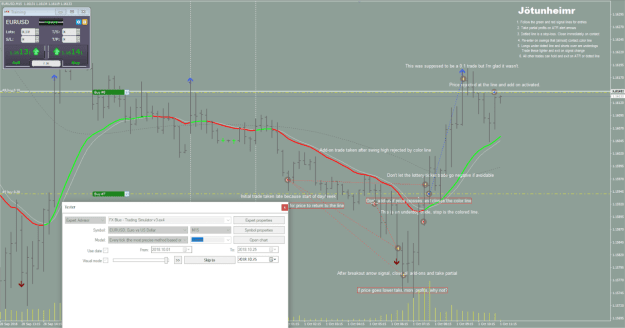
Fig. 1 Enter/Exit logic
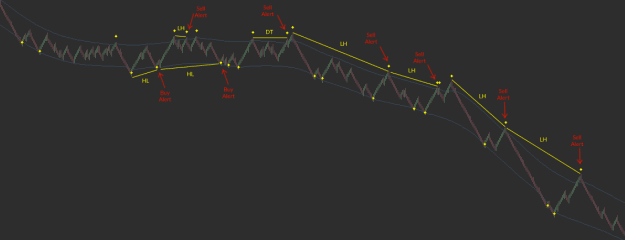
Enter long on a ‘buy’ signal and enter short on a ‘sell signal’. Only enter on valid signals, near or at inner band or container band piercings. Only add to positions when the corresponding previous position was part of a favorable pattern (explained below).
For example.
(Fig.1) In the diagram above the first yellow dot to the far left is a bullish band piercing but it is not yet a valid signal as it requires a subsequent buy signal that is higher (a higher low or HL as it is labelled). The second dot is a valid buy signal and an entry point as it makes a higher low.
Something that watches higher highs and higher lows using a renko brick or a point and figure chart is something worth building upon. Why have I mixed it all up with this other voodoo?
This system does not (yet) trade long and short simultaneously, so the subsequent sell signals are ignored. Note that they are also rising, confirming the bullish trend. The next buy signal is also a higher low, confirms the bullish trend and is an opportunity to pyramid. The centerline of this band (not pictured) would be rising bullishly. The other two buy signals are lower, but are part of a cluster, so they would be ignored. When price reaches the other side of the band, set a SL to break even.
If price hadn’t reached the other side, the trade would have failed, and you’d exit on the next bottom band break, a buy signal that is a deeper trough (lower than the previous buy signal clusters). In this case price does reach the other band and creates a new high and a (invalid) sell signal (a higher sell than the previous cluster and so, ignored). If it had begun retracing before creating a new high, thereby creating a valid sell signal (lower high) , we would exit the trade early or let the SL take us out for a small gain or breakeven.
The subsequent sell signals (dots 9-10) are unclear as they are basically level with each other. This system advises ignoring signals that aren’t clearly higher or lower than previous ones. The second sell alert labelled in Fig. 1 should probably be ignored. However, after price reaches its peak near the 11th dot (band piercing) it drops sharply, almost certainly hitting our SL and taking us out for a tiny profit or breakeven. The 12th dot is an invalid buy signal (lower than the previous buy signal cluster) and would signal an exit to this trade if the SL hadn’t been triggered for some reason.
The next entry opportunity (short) is after the third sell alert, where price pierces the top band, and makes a new lower high. Price continues to trend lower, giving us several more opportunities to add to our short position. We would continue adjusting the stop, securing profit, according to a mechanism I haven’t devised yet, and would still be in the trade at the end of the diagram. We would exit on a container band piercing, or a higher high -- a sell alert that is higher than its predecessor. Note this takes us out of the trade, but it isn’t a buy signal until price pierces the bottom band, and makes a higher low, higher than the previous buy signal.
If this is confusing, here’s another way to describe it.
- Enter long on a new blue dot cluster that is higher than the most recent old one, and enter short on a red dot cluster that is lower than the most recent old one.
- Exit long or short on a container band piercing or exit long trades on any red dot cluster that is lower than the most recent old one, or any blue dot cluster that is lower than the most recent old one.
This is the origin of one of my 'trade order' principles.
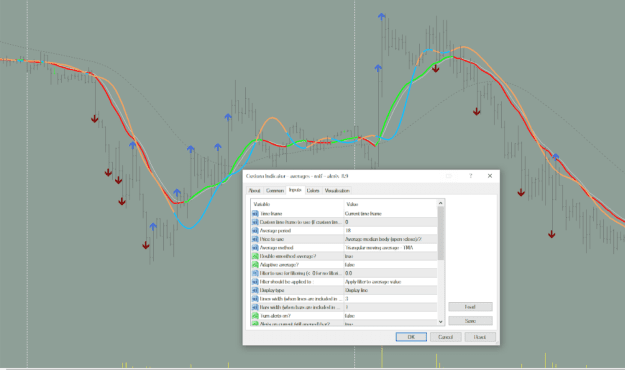
Alternate entry: Sometimes, after a band pierce, price moves too fast to make a retrace for the entry signal. So after such a piercing and reversal, watch for the supersmoother candles color to change, and enter in their signalled direction. Augh. complication.
Solved with Renko, hopefully.
Don't hope. Too complicated for sure.
I continue in much more detail talking about the Renko indicator. It probably deserves its own post.