• Home
  • Forums
  • Trades
  • News
  • Calendar
  • Market
  • Brokers
  • Login
  • Join
  • User/Email: Password:
  • 11:27pm
Menu
  • Forums
  • Trades
  • News
  • Calendar
  • Market
  • Brokers
  • Login
  • Join
  • 11:27pm
Sister Sites
  • Metals Mine
  • Energy EXCH
  • Crypto Craft

Options

Bookmark Thread

First Page First Unread Last Page Last Post

Print Thread

Similar Threads

VSA-divergence trading 187 replies

How to Blow $200 account using VSA--- 594 replies

VSA Journal 57 replies

VSA broker history change datas 11 replies

  • Interactive Trading
  • /
  • Reply to Thread
  • Subscribe
  • 12,324
Attachments: vsa with Malcolm
Exit Attachments
Tags: vsa with Malcolm
Cancel

vsa with Malcolm

  • Last Post
  •  
  • 1 17921793Page 179417951796 1802
  • 1 Page 1794 1802
  •  
  • Post #35,861
  • Quote
  • Oct 16, 2022 11:42pm Oct 16, 2022 11:42pm
  •  Anotan
  • Joined Jan 2015 | Status: Member | 1,209 Posts
Quoting Frag8383
Disliked
I have to trade at 6 uk time for an hour, I trade the 1 min and 5 min chart.
Ignored
So 6 am London is an hour before Frankfurt open? And also you're only trading for 1 hour a day, and you only want to hold that trade for 1 hour?

Thats pretty tough, you have a lot of things going against you. First that time of day is going to be slow because traders are waiting to see what FO and LO will do. Because its slow your commission is going to eat a huge chunk of your profits as well as compound your losses.

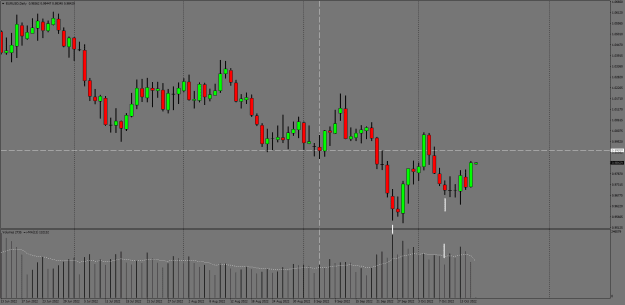
Forex is a slow market, it tends to grind sideways for hours and hours before making a move, Friday I shorted EJ a couple of hours into Asia and it took 5 hours before the pair started moving south. Maybe spot gold/oil would be better? They tend to be faster markets. Either way do your back testing to get an idea of what you can expect.

Also only trading an hour doesn't give you a lot of time to do your background analysis on top of finding a trade. If I were in your situation I'd go up to a H4/H8/H12/D1 time frame. I don't do much for the first 2-3 bars after I get into a trade, if I was trading a H4 chart that would give me 8-12 hours before I'd have to look at my charts again.
The background just doesn't disappear.
 
 
  • Post #35,862
  • Quote
  • Edited 2:34am Oct 17, 2022 1:55am | Edited 2:34am
  •  Anotan
  • Joined Jan 2015 | Status: Member | 1,209 Posts
Friday we found support at 0.9717 and now price is rallying off a ND test.

Attached Image (click to enlarge)
Click to Enlarge

Name: EURUSDH1.png
Size: 22 KB


Drop down to a M15 we see that in Asia EU was hit with supply but as price dropped down to the lows of the supply a test forms which price is currently moving up. You can see on the right edge that price is struggling with the highs of the supply which means there is a risk here price can go down, but with Friday respecting .9717 I don't want to be short.

Attached Image (click to enlarge)
Click to Enlarge

Name: EURUSDM15.png
Size: 19 KB

Closed out, too many sellers around. I went in with a single entry and I was looking for price to clear the high of that supply bar in Asia, once that high was clear it would have left me open to add to my position. But that high was never cleared and exited with only a partial position. MEs are so helpful as long as you don't average down, once price price proves your entry right then its game on.

Attached Image (click to enlarge)
Click to Enlarge

Name: EURUSD.png
Size: 20 KB
The background just doesn't disappear.
 
1
  • Post #35,863
  • Quote
  • Oct 17, 2022 6:33am Oct 17, 2022 6:33am
  •  RickM
  • Joined Sep 2015 | Status: Member | 2,138 Posts
Quoting Frag8383
Disliked
Guys I hope you all had a nice weekend. I need to ask a question not about trading but about the best instrument to trade before Europe Open. Due to a change of jobs I cant trade the London open one hour before and 1 after now I have to trade at 6 uk time for an hour, I trade the 1 min and 5 min chart. I do not mind about spreads since I trade a raw spread account with ic markets and i get charged a commission not on spread. I used to trade the majors but the are better traded at the Europe and uk open which i cant trade now. Please if anyone had...
Ignored
Hi Frag

Well you have set yourself up for a tough trading task but don't let any one tell you it can't be done.
The issue is of course and you know this - Volume levels may not be consisent enough to draw tradeable candles.

But

Here is my opinion for what its worth.
1... Trade M1 only but candles must be producing reasonable size wicks.
2... ATR of each M1 candle must have increased markly over the recent hour.
3... Supply & Demand levels normal hold but price will run one direction as time gets closer to London Open.

Markets - The only market at this time that I would ever depend on is NQ (ICM its USTEC) as volume levels now are acceptable always.
Whether the Spreads will be worth the effort depends on your broker.

EURUSD - The one forex market that holds its wicks, offers ATR that may be good enough to trade without fail.

JPY pair if there is news around, normally EURJPY or GBPJPY. Some will like USDJPY but I would really like it burned to a crisp at a bonfire.

Personally, I trade EURUSD & S&P only these days as its all I need.

Just don't trade if the wicks aren't there on M1
Trading thin liquidity at the boundary of the charts
 
5
  • Post #35,864
  • Quote
  • Oct 17, 2022 7:25pm Oct 17, 2022 7:25pm
  •  Anotan
  • Joined Jan 2015 | Status: Member | 1,209 Posts
Quoting Anotan
Disliked
Friday we found support at 0.9717 and now price is rallying off a ND test. }
Ignored
So yesterday as long as price stayed above 9717 I was only looking for buys.

PA was messy during LO and the first part of US, to get around it I just waited for price to break above the weakness EU saw in Asia, after the break out I saw an UT that was going to trap range traders and just added to my position as price went up.

Attached Image (click to enlarge)
Click to Enlarge

Name: EURUSDM15.png
Size: 21 KB


There is strength on Daily charts, stopping volume on Sept 26th and a test on Oct 10th, its worth holding any longs and building positions as price moves up.

Attached Image (click to enlarge)
Click to Enlarge

Name: EURUSDDaily.png
Size: 16 KB
The background just doesn't disappear.
 
2
  • Post #35,865
  • Quote
  • Edited 12:33am Oct 18, 2022 12:03am | Edited 12:33am
  •  Anotan
  • Joined Jan 2015 | Status: Member | 1,209 Posts
Squat bar in early Asia on EU M15.

A lot of volume on a small spread. Just building my snow ball, I doubt this will take off like that AU short last week but anything can happen.

Attached Image (click to enlarge)
Click to Enlarge

Name: EURUSDM15.png
Size: 20 KB


Price broke into fresh new high ground which does leave us vulnerable for a reversal. Took a couple of TPs so I can at least walk away with something if this decides it wants to come down. Probably done for today, but lets see if tomorrow is worth building more positions.


Attached Image (click to enlarge)
Click to Enlarge

Name: EURUSDH1.png
Size: 24 KB
The background just doesn't disappear.
 
4
  • Post #35,866
  • Quote
  • Edited Oct 19, 2022 7:50am Oct 18, 2022 10:22pm | Edited Oct 19, 2022 7:50am
  •  Anotan
  • Joined Jan 2015 | Status: Member | 1,209 Posts
We going to give EU a little break today. Yesterday is looking very mixed and I'd rather let EU sort itself out today.

Attached Image (click to enlarge)
Click to Enlarge

Name: EURUSDH1.png
Size: 21 KB

What's interesting today is AJ. In our background Oct 14th & 17th the pair found strength, which on the 17th I threw a little precursory trade on it nothing big. Yesterday the PA found a stupidly wide 60 pip wick. Those wide wicks are usually unreliable, often times price goes against wide wicks. But on this one price is respecting the wick plus so far we've only seen one close below the HVC.

Today in Asia we're already seeing strength on the PA, lets see if price can come off a little for some buys.

Attached Image (click to enlarge)
Click to Enlarge

Name: AUDJPYH1.png
Size: 21 KB
The background just doesn't disappear.
 
2
  • Post #35,867
  • Quote
  • Edited 4:37am Oct 20, 2022 2:14am | Edited 4:37am
  •  Cyberforex
  • Joined May 2020 | Status: Member | 282 Posts
Quoting RickM
Disliked
{quote} Hi Frag Well you have set yourself up for a tough trading task but don't let any one tell you it can't be done. The issue is of course and you know this - Volume levels may not be consisent enough to draw tradeable candles. But Here is my opinion for what its worth. 1... Trade M1 only but candles must be producing reasonable size wicks. 2... ATR of each M1 candle must have increased markly over the recent hour. 3... Supply & Demand levels normal hold but price will run one direction as time gets closer to London Open. Markets - The only...
Ignored
the quote : ... don't let any one tell you it can't be done ...
a nice quote like in the movie "The Pursuit of Happyness" - Will Smith, inspiring

but if an experience trader gave an advice then someone should pay attention to what he said, Anotan is an experience trader one of the best here and i'm agree with him if you have no time to look at screen then should go to higher timeframe and before EU is not a good timing for scalping due to small range - less volatility and less liquidity ... the best time to trade is around EU/LDN and NY time, if you can not trade around EU/LDN then what about NY time? if you want to stick with M1 then NY time will offer a good opportunity for scalping otherwise the only logical solution is going with higher TF ...

but if you want to keep the quote ... don't let any one tell you it can't be done ... then it is up to you ... see in the next 5 years then see how successfull you are ...

my quote : forex trading is easy it only needs just 1-2 months (no need 10.000 h screening time) to be at professional level if they can read the chart correctly and trade effectively ...

===========================================

@Macallik
https://www.forexfactory.com/thread/post/14137549#post14137549

its a pity i would like to put my trade pics so that my fellow traders here can see where the entries were for learning purpose but because of no explanation (although i gave sometimes the reason) some trader here ignored me, no problem at all for me ... actually it just needs a small effort to look for the reason with VSA basic knowledge (i prefer proactive learning to get AHA effect then to read the reason from someone else which is sometimes not correct and we already have thousands pics here in this thread with explanations) ... my intention was if i put my successfull trades everyday and someone give small effort (not lazy) to find the reason i promise you dont need 2 months even 1 month is enough to get a sense how to trade effectively ... my trader team with vsa knowledge will be just happy to see my trades because for them no need for explanation, they just need to know where the entry and the reason they can find itself easily (i have 3 teams to support me : 1 team for trading stocks, 1 team for commodities and 1 team for currencies).

Someone missunderstood my intention putting my trades in forum, its not to show off ... its for educational purpose for proactive learning and not for lazy traders ... for proactive learner it will keep in their brain much better if they can find the reason itself with AHA effect and if they cant find the reason ask in the forum or pm me (not for people to bend the knee to get the answer as you wrote it ... your assumption its totally wrong Mate! - that makes me no fun at all to put my trades in forum again) ... even i dont want to put my trades in bigger forum like GBPUSD or others because my intention is only for this small forum and this vsa community ... and also no need to show off because i dont offer training, trading signal and also managing account ....

Ok happy trading guys .... i am back idle again ....
 
2
  • Post #35,868
  • Quote
  • Oct 20, 2022 5:11am Oct 20, 2022 5:11am
  •  RickM
  • Joined Sep 2015 | Status: Member | 2,138 Posts
Quoting Cyberforex
Disliked
{quote} the quote : ... don't let any one tell you it can't be done ... a nice quote like in the movie "The Pursuit of Happyness" - Will Smith, inspiring but if an experience trader gave an advice then someone should pay attention to what he said, Anotan is an experience trader one of the best here and i'm agree with him if you have no time to look at screen then should go to higher timeframe and before EU is not a good timing for scalping due to small range - less volatility and less liquidity ... the best time to trade is around EU/LDN and NY...
Ignored
Hi Cyberforex

I should have mentioned the time when I wrote that post, it was 50 minutes before Frankfurt Open and at this time, there are only two markets that have enough market participation to be able to trade using volume. Thats EURUSD and often Nasdaq.
15 minutes later, many other markets like GBPUSD, Gold, other World indices finally obtain enough executed orders levels to be able to trade safety.

I just wish amateur traders understood this statement -

VOLATILY OF THE MARKET ISN'T IMPORTANT - MARKET PARTICIPATION IS EVERYTHING

I have actually been extensivity trading EURUSD for longer than 5 years on M1 because it has high market participation rates and almost as importantly, it offers low absorption levels enabling me to achieve good profitability with lower risk. In short, trading EURUSD offers volume traders an edge most markets don't provide.

There is no point me expanding on my comments because even thought I started trading with VSA Volume stategy's around 2005, I moved on to other forms of order flow volume trading now using different methods, ideas and tools which just suit me much better now.

We are on the same team, the data along with the strategies we use is just viewed from a different hilltop.


Cheers and safe trading
Trading thin liquidity at the boundary of the charts
 
2
  • Post #35,869
  • Quote
  • Oct 20, 2022 5:33am Oct 20, 2022 5:33am
  •  Cyberforex
  • Joined May 2020 | Status: Member | 282 Posts
Quoting RickM
Disliked
{quote} Hi Cyberforex I should have mentioned the time when I wrote that post, it was 50 minutes before Frankfurt Open and at this time, there are only two markets that have enough market participation to be able to trade using volume. Thats EURUSD and often Nasdaq. 15 minutes later, many other markets like GBPUSD, Gold, other World indices finally obtain enough executed orders levels to be able to trade safety. I just wish amateur traders understood this statement - VOLATILY OF THE MARKET ISN'T IMPORTANT - MARKET PARTICIPATION IS EVERYTHING I have...
Ignored
Hi Rick,

you are one of best M1 trader out there, if you trade successfully with M1 just go ahead ... for me its the most difficult TF to trade ... it needs a lot of experience and screening time to be succesfull to trade on M1, therefore i never advice to trade on lower TF especially to the new trader because it takes a lot of time to master it ... maybe someone needs special trainer for that ....

normally you trade at late NY after everything is seattle as long as i remember reading your post ... did you change to EU-LDN time right now?
 
 
  • Post #35,870
  • Quote
  • Oct 20, 2022 6:22am Oct 20, 2022 6:22am
  •  RickM
  • Joined Sep 2015 | Status: Member | 2,138 Posts
Quoting Cyberforex
Disliked
{quote} Hi Rick, you are one of best M1 trader out there, if you trade successfully with M1 just go ahead ... for me its the most difficult TF to trade ... it needs a lot of experience and screening time to be succesfull to trade on M1, therefore i never advice to trade on lower TF especially to the new trader because it takes a lot of time to master it ... maybe someone needs special trainer for that .... normally you trade at late NY after everything is seattle as long as i remember reading your post ... did you change to EU-LDN time right now?...
Ignored
Hi Cyberforex

Now we are boring everyone so one last comment.
I normally turn the charts on 1 hour before London open and turn them off two hours after New York open.
If the participation levels are strong for EURUSD or S&P. I trade them for 30 minutes on SIM to get up to speed on the markets then trade them on live charts
ONLY if I pass my benchmark.

You can't trade M1 cold - you need to be nailing your setups first
Trading thin liquidity at the boundary of the charts
 
3
  • Post #35,871
  • Quote
  • Oct 22, 2022 3:06pm Oct 22, 2022 3:06pm
  •  HiddenGap
  • Joined Aug 2009 | Status: Reading the tape | 2,324 Posts
Attached Image (click to enlarge)
Click to Enlarge

Name: VSA 1.jpg
Size: 569 KB


60 Min (left side)

1. Wide spread UP bar with a poor close (off the high) on Ultra High Volume with the next bar DOWN. This is Supply. Weakness, when it appears, usually appears on UP bars.

5 Min (right side)

1. UP bar with a range smaller than the previous bar on increasing volume. This is a Squat. If all the volume was buying, the range should be wider. What is causing the range to compress? Only one thing can do it: Supply(Selling).

2. Increasing range UP bar on increasing volume closing off it high (poor close). Note that the volume, while increasing from the previous bar, is diminishing overall.

a. The Market is moving up, but the up waves have decreasing volume. Wave volume and price are diverging. This is showing a Shorting of the Thrust (SOT).

3. Narrow range UP bar that closes in the middle on volume less than the previous two bars. This is No Demand. Note the clustering of closes. Buyers aren't making any real progress at this time.

4. The bar prior is a Test which fails on this wide spread DOWN bar on increasing volume that starts out trading higher, but fails to follow thru and closes near its low. This is a Trap Up Move and an indication of Supply.

The two aggressive entries (the highest probability entries are yet to be seen):

5. Up Thrust.

6. No Demand.

Higher probability entries come after there has been a Change of Behavior (COB). The COB is evidenced in two ways:

1. After we see a Lower High (LH) we see a Lower Low (LL) followed by another Lower High (LH). This is the definition of a a down trend- lower highs and lower lows.

2. b. Wave volume to the downside (Supply) becomes larger than any other downside wave for more than an hour. Wave volume to the downside is large in terms of time (three bars of down wave volume is the most since the 930 open).

7. Technically, you don't know that this is a LH until at a couple bars later, but this Up Thrust is within the body of the the Supply/Gotcha bar that occurred after the No Demand interval.

8. A clear COB is evident and we see a bar that makes a higher high but closes on its low directly following a Test (which fails).
Wyckoff VSA: (1) Supply vs Demand (2) Effort vs Result (3) Cause vs Effect
 
5
  • Post #35,872
  • Quote
  • Oct 22, 2022 4:00pm Oct 22, 2022 4:00pm
  •  HiddenGap
  • Joined Aug 2009 | Status: Reading the tape | 2,324 Posts
Attached Image (click to enlarge)
Click to Enlarge

Name: VSA 4.jpg
Size: 541 KB


60 Min chart (left side)

* Weakness, when it appears, usually appears on UP bars with high volume. This does not mean ALL UP bars on high volume are weak.

1. Wide spread UP bar on Ultra High Volume that closes on its high. This bar is Jumping across the creek (JAC). Sometimes it takes a lot of effort (volume and range) for the Market to move above resistance. While there is certainly some selling in this bar, this bar represents strength (Demand).

The next bar is DOWN, but not the volume is almost a large as the previous bar while the range is smaller. This is Effort vs Result (EvR). Something is capping the downside movement of the market. The only thing that can do that is Demand (buying).

On the bar after that, the "boy scout" comes back and Tests the creek.

You should not be looking for anything but longs in this Market. This will be further evident as the Market begins to one time frame higher for the rest of the day.

5 min chart (right side)

1. Prior to the open an interesting bar. It is a wide spread UP bar on ultra High volume that closes in the middle of its range. There must have been selling on this bar for it to close in the middle and not on its high. The next bar is UP, thus not confirming the Supply.

2. This interval looks similar to the 1. It is a wide spread DOWN bar that closes in the middle of its range. If all that volume was selling, the close would not be in the middle of the range. The next bar is UP confirming the strength.

3. This bar trades down below support then trades and closes above it on increased volume. This is a Spring and a sign of strength. Technically, this if our first possible long entry. We do note that the wave volume is decreasing (down swing) but the volume is less then the volume seen on the previous up swing. Probabilities not certainties.

4. We are only looking to get long, but this No Demand is of note as it creates a Lower High (LH).

5. We see shorting of the thrust (SOT) as we see a DOWN bar with a narrow range that closes off its low. We note that the Market is making a lower low (LL) but there is divergence with the Wiese Wave.

6. Narrow range DOWN bar on volume less than the previous two bars. This is No Supply. Wave volume is miniscule, confirming the lack of Supply in the Market at this time.

7. Resistance acts as Support as we see the bar trade below and then trade above and close above the green line. This is a Spring. This bar creates a Higher Low (HL).

8. The previous bar traded higher than the ND meaning a higher high will be created. Higher highs and Higher lows is the definition of an up trend. This bar has a narrow range, closes DOWN and has volume less than the previous two bars. This is No Supply. Wave Volume is barely registering the Supply.

9. Entry#2. Wide spread UP bar that makes a lower low than the previous bar and closes near its high. The UP close confirms the No Supply.
Wyckoff VSA: (1) Supply vs Demand (2) Effort vs Result (3) Cause vs Effect
 
8
  • Post #35,873
  • Quote
  • Oct 25, 2022 2:08am Oct 25, 2022 2:08am
  •  robysunnen
  • | Joined Jul 2019 | Status: Member | 114 Posts
buongiorno condivido questo file se vi fà piacere
Attached File(s)
File Type: pdf Advance VSA Techniques.pdf   8.1 MB | 236 downloads
 
1
  • Post #35,874
  • Quote
  • Oct 25, 2022 2:47am Oct 25, 2022 2:47am
  •  pooh123
  • Joined Jul 2012 | Status: Member | 783 Posts
Quoting robysunnen
Disliked
buongiorno condivido questo file se vi fà piacere {image}
Ignored
Thanks for sharing. I browsed through the PDF file and found it consists of screenshots marked with Wyckoff terminology as taught by Dr. Romanov/Golden Gate University. I've studied the Wyckoff courses of Dr. Romanov and thought they were mainly for stock trading above intra-day timeframe. In those courses I saw a lack of linkage with intra-day forex trading. However, it looks that the author of this PDF file is well-versed in applying Dr. Romanov's Wyckoff to intra-day forex trading. I'll delve into it. Thanks again.
 
1
  • Post #35,875
  • Quote
  • Edited 12:04pm Oct 25, 2022 11:19am | Edited 12:04pm
  •  Anotan
  • Joined Jan 2015 | Status: Member | 1,209 Posts
Quoting RickM
Disliked
{quote} I just wish amateur traders understood this statement - VOLATILY OF THE MARKET ISN'T IMPORTANT - MARKET PARTICIPATION IS EVERYTHING...
Ignored
I do understand that you're here just to offer an alternative view, and I'm not going to pretend that I understand all of the facets of your style. You remind me a lot of Autrader, but back to the point isn't this bad logic for this discussion?

You have a trader IIRC was asking about trading for a duration of 1 hour, 1 hour before FO? Just pulling up an H1 chart with ATR of 10, the past 5 days on EU there has only been 1 trading day with an ATR above 13 pips on the H1 bar prior to FO. Not to mention that right now EU daily range is on the high side at 140 pips, as an average EU tends to hover closer to 70 pip ADR. When EU returns back to 70 pip ADR, an educated guess is that bar with less than a 15 pip range now is going to be reduced to lower than a 10 pips range.

So yeah, volatility isn't important considering the duration the trader has and time of day they're available?
The background just doesn't disappear.
 
4
  • Post #35,876
  • Quote
  • Oct 27, 2022 12:39pm Oct 27, 2022 12:39pm
  •  robysunnen
  • | Joined Jul 2019 | Status: Member | 114 Posts
Quoting pooh123
Disliked
{quote} Grazie per la condivisione. Ho sfogliato il file PDF e ho scoperto che consisteva in schermate contrassegnate con la terminologia Wyckoff insegnata dal Dr. Romanov/Golden Gate University. Ho studiato i corsi Wyckoff del Dr. Romanov e ho pensato che fossero principalmente per il trading di azioni al di sopra di un periodo di tempo infragiornaliero. In quei corsi ho visto una mancanza di collegamento con il forex trading intraday. Tuttavia, sembra che l'autore di questo file PDF sia esperto nell'applicare Wyckoff del Dr. Romanov al forex trading...
Ignored
Ciao POOH123 ho visto che ti piace wickoff se hai qualcosa da condividere mi farebbe piacere grazie ancora
 
 
  • Post #35,877
  • Quote
  • Oct 27, 2022 6:51pm Oct 27, 2022 6:51pm
  •  Macallik
  • | Joined Sep 2010 | Status: Member | 182 Posts
The Bitcoin story looks like a drawn-out dogfight between bulls and bears on the Daily/Weekly, but a bit clearer on the Monthly:
Attached Image (click to enlarge)
Click to Enlarge

Name: OeiRcB3D.png
Size: 32 KB


  1. Closes off the lows. Buying present. Could classify as Preliminary Support in Wyckoff terms
  2. Bears regain control
  3. No Demand in response to the selloff. Expect lower prices
  4. Note the drop-off in volume on the push lower. Supply seems to have disappeared at these prices
  5. Effort vs Results. The smallest trading range since October 2020, yet the 3rd highest month of volume ever recorded. Accumulation taking place
  6. Heavy volume test Supply is still present so prices could go lower to eat up supply or perhaps a lower % push higher in November


Personally, I have abstained from the crypto world but I will look to get some exposure via publicly traded companies that are highly correlated (MARA,COIN,RIOT, etc)

 
4
  • Post #35,878
  • Quote
  • Oct 29, 2022 4:38pm Oct 29, 2022 4:38pm
  •  HiddenGap
  • Joined Aug 2009 | Status: Reading the tape | 2,324 Posts
Diary of a trade.

The Big Picture:

Attached Image (click to enlarge)
Click to Enlarge

Name: VSA 5.jpg
Size: 553 KB

I got out too early. Price did move the second target (IB Target) and beyond. Being right and sitting tight, that's where the money is.

Phase 1:

Attached Image (click to enlarge)
Click to Enlarge

Name: VSA 6.jpg
Size: 476 KB

1. Wide spread UP bar on Climatic volume that closes off its high. Weakness, when it appears, usually appears on UP bars. While there had to be some selling on this bar, the next interval does not confirm this as it closes UP.

2. This is an Up Thrust. Buyers push price higher than the previous bar, and then Sellers inter the market and slam price back down. However, price closes off the low. If Sellers were in control at the end of the bar, the close should be on the low.

3. Buyers again enter and push price higher and again Sellers enter to push price down. But we note that the bar closes level to the previous bar. Sellers are putting in effort but the result is no real progress as we see closes begin to cluster in the same area. If Sellers were taking over this market, price should be closing DOWN.

4. Bingo. This is a Spring at a known line of support/resistance. Sellers make a push down, but buyers step causing price to trade higher and close near to top of its range. We again note the close the same as the previous two closes. Sellers are making no progress. Sellers managed to take price below support, but gave it up and price closed back above it. Buyers are in control of this Market.

Phase 2.

Attached Image (click to enlarge)
Click to Enlarge

Name: VSA 7.jpg
Size: 464 KB

1. The second of the two most important ranges (the Overnight range and the Initial Balance range) is set two intervals prior. At this known range extreme, we see a narrow range bar with volume less than the previous two. This is a Test. Tests will often appear just below a known resistance area before it breaks. Or just above the resistance now acting as support line.

A good place to move the stop to would be either just below the Test or just below the IBH.

Phase 3.

Attached Image (click to enlarge)
Click to Enlarge

Name: VSA 8.jpg
Size: 449 KB


1. After seeing a clustering of closes on the previous two bars, we see a narrow range UP bar that closes in the middle of its range on volume less than the previous two bars. This is No Demand. Buyers are still in control, but the clustering of closes shows little progress is being made. The decrease in volume is showing buying interest is waning.

2. Up Thrust like bar causes the early exit. When the trend channel is added, we see that this is occurring at the top of the channel, and therefore is a reasonable place to look to exit. However, in truth, our target is the the IB Target, which is much higher.

It's Friday. We take a one shot, one kill mentality and call it a day.....
Wyckoff VSA: (1) Supply vs Demand (2) Effort vs Result (3) Cause vs Effect
 
5
  • Post #35,879
  • Quote
  • Oct 29, 2022 7:45pm Oct 29, 2022 7:45pm
  •  bluesoul
  • Joined Sep 2010 | Status: Member | 655 Posts
GU is above 1.14(last monthly low of March 2020)
If monday closes above or near 1.1737(last month high) that will be monthly close above the lows.
Last month was ultra high volume down bar closing above the middle, if this month closes above the last month bar, then we last month is a shakeout and we are looking at at potential reversal, and strong bullish trend to start soon targeting 1.30
Attached Image (click to enlarge)
Click to Enlarge

Name: screenshot.png
Size: 29 KB
Holy Grail - Patience and Acceptance
 
3
  • Post #35,880
  • Quote
  • Oct 29, 2022 7:51pm Oct 29, 2022 7:51pm
  •  HiddenGap
  • Joined Aug 2009 | Status: Reading the tape | 2,324 Posts
Attached Image (click to enlarge)
Click to Enlarge

Name: VSA 9.jpg
Size: 613 KB

60 Min Chart (left side)

1. Crazy price action to start the day. At first glance, this appears to be a two bar reversal. The previous bar closed off its high on ultra high volume. This bar makes a higher high and a lower low. Buyers pushed the price UP and then Sellers stepped in and took price in the opposite direction. Even managing to take price lower than the previous low. The key is the inability of the Sellers to keep price at the low and even below the prior low. Buyers must be in control of this bar at the end of the period.

For the aggressive trader, there is a Spring on the 5 min at the ONL. One needs to be really fast and looking for the overnight sweep trade many profile traders know about (more on the 5 min.).


2. Wide spread UP bar on climatic volume that closes well off its high. Buyers pushed price up and made a higher high, but they were met with Sellers that pushed price down below the midpoint.


5 Min Chart (right side)

1. This is a Spring (Test). This narrow range bar dips down below known support then price moves up and closes on its high. It does this on volume less than the previous two bars. We note that the previous bar was a narrow range bar that closed near its low on Climatic Volume. This is a squat. Something is compressing the range on this interval. The only thing that can be doing that is Demand.

Again, a very aggressive entry for the overnight sweep trade: in this case ONL to ONH.

2. Wide spread UP bar on Climatic Volume that closes off its high, but does not confirm with the next bar DOWN. The first sign of Supply entering the Market. While the next interval does not confirm, by being down, there must have been some selling in this bar. But the next bar is a No Demand bar in its own right.

3. A narrow range UP bar on increasing volume. This is a Squat. Something is capping upside movement. And the only thing that can do that is Supply. We note the upside progress made on bar 2 versus the upside progress on this bar. The ease of movement is not as easy. We also note that we are making a higher high as Wave volume is decreasing. There is a shortening of the thrust (SOT).

4. Up Thrust. An increasing range bar that makes a higher high than the previous bar and then closes DOWN near its lows. Buyers pushed price up and met Sellers that overtook them, sending price down.

This is the "opposite of a Spring" and is happening at known resistance. This sets up an aggressive overnight sweep trade in the opposite direction. ONH-ONL.

5. No Demand bar that sets up our first Lower High (LH).

6. Another No Demand Bar. Note that price was below a known support/resistance line as the ND appeared, and the ND closed on the line.

7. Highest probability entry. We have weakness in the background, there has been a change in behavior as the Market is now making lower highs and lower lows. Price is pushed above the know support/resistance line, Sellers step in a push price down to the low and close below the support/resistance line on increasing volume. This is an Up Thrust.

This is the entry I took.

8. This is not a high probability entry, even though I took it. It is a good example of a Spring. Price found support (left side) on what would become the IBL. Volume is very high. Price is now back in that same area and volume is comparatively low. There was a ease of movement to the Upside while the downside movement was more stair-step like.
Wyckoff VSA: (1) Supply vs Demand (2) Effort vs Result (3) Cause vs Effect
 
5
  • Interactive Trading
  • /
  • vsa with Malcolm
  • Reply to Thread
    • 1 17921793Page 179417951796 1802
    • 1 Page 1794 1802
0 traders viewing now
  • More
Top of Page
  • Facebook
  • Twitter
About FF
  • Mission
  • Products
  • User Guide
  • Media Kit
  • Blog
  • Contact
FF Products
  • Forums
  • Trades
  • Calendar
  • News
  • Market
  • Brokers
  • Trade Explorer
FF Website
  • Homepage
  • Search
  • Members
  • Report a Bug
Follow FF
  • Facebook
  • Twitter

FF Sister Sites:

  • Metals Mine
  • Energy EXCH
  • Crypto Craft

Forex Factory® is a brand of Fair Economy, Inc.

Terms of Service / ©2023